Two-Speed Everywhere
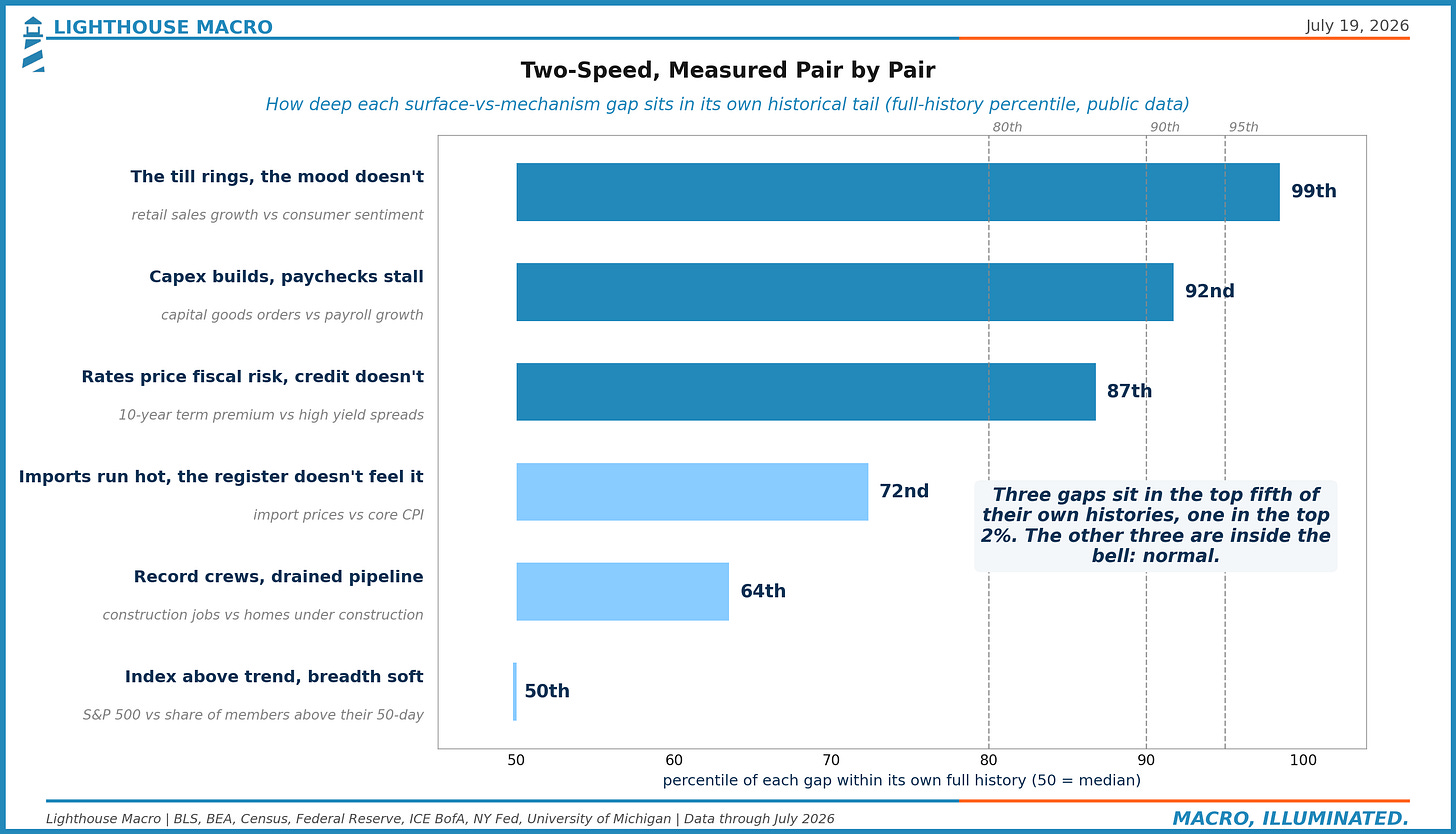
Every calm headline has a fast engine and a stalling one underneath. Three of the gaps are now deep in their historical tails, and one regime holds them open.
THE THROUGH-LINE
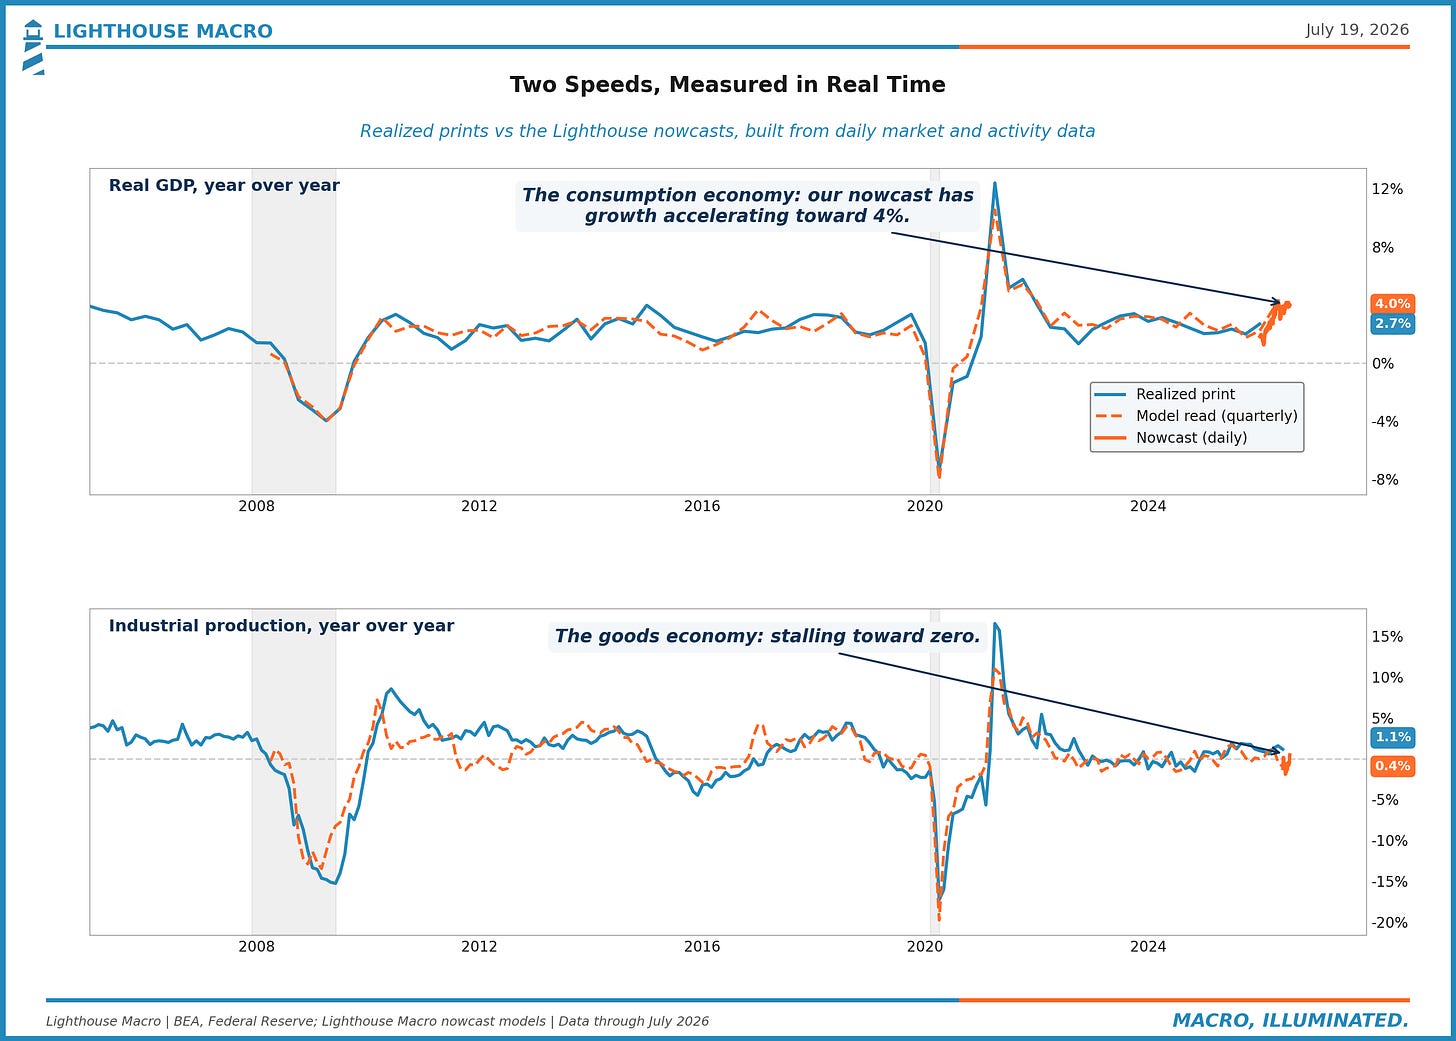
Start with something that happened inside our own models this week, because it frames everything else. We run a set of nowcasts, models that read daily market and activity data and map it onto the official series before the official series prints. In the same week, on the same data, two of them split hard in opposite directions. The GDP nowcast is sitting at roughly 4% year-over-year growth and holding, well above the 2.7% last print. The industrial production nowcast has the goods economy stalling toward zero, at less than half its last print. One economy accelerating, one economy stalling, measured daily, at the same time.
That split is the report. Almost every headline that reads calm right now has a fast engine and a stalling one underneath it, and once you start looking for the pattern you find it everywhere.
The bond market is charging rent on duration again. The 10-year term premium sits near the top of its 20-year range, and it has held there for months. It is the only market pricing what we think is the actual regime.
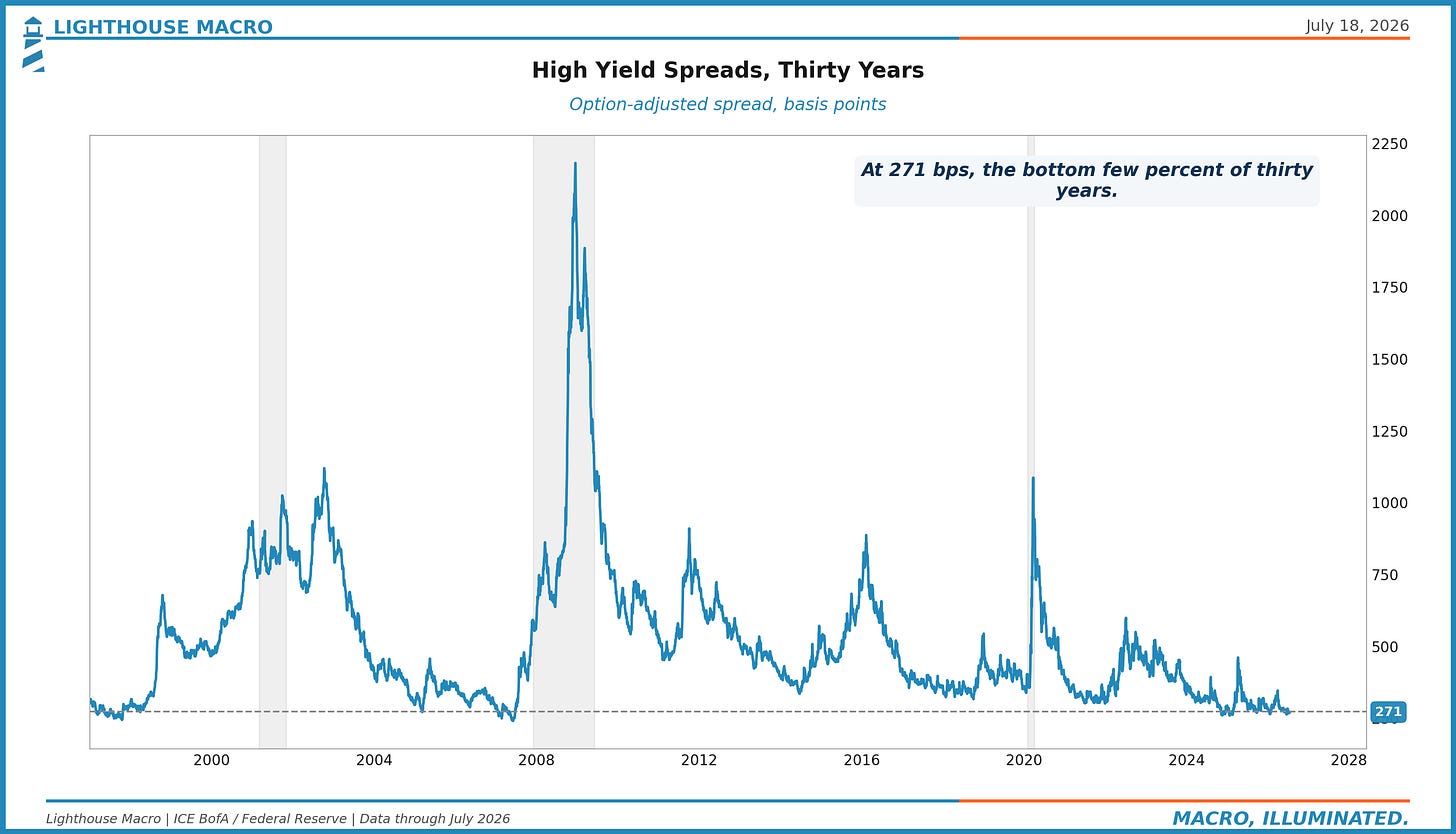
Credit is priced for perfection. High yield spreads sit in the bottom few percent of thirty years. There is a sliver of room left to compress and a canyon of room to widen, and the premium for quality inside investment grade is at its thinnest in thirty-six years.
Inflation is hot upstream and quiet downstream. Import prices went from roughly zero in December to almost 7% by June. The register has not felt it yet.
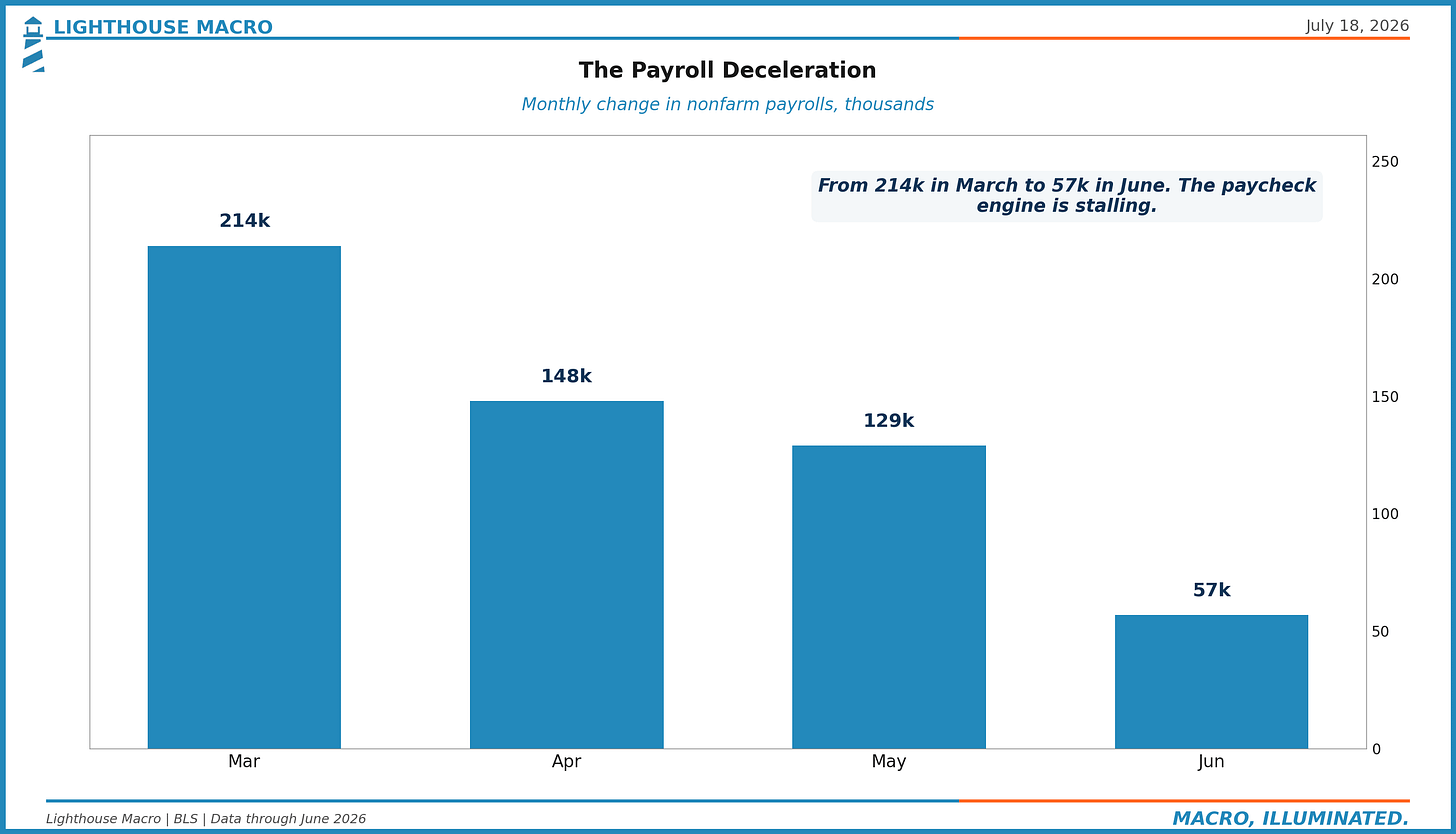
The economy builds while the paycheck stalls. Chip production is running north of 20% annualized and core capital goods orders are up double digits, while payroll growth has collapsed from 214,000 to 57,000 since March.
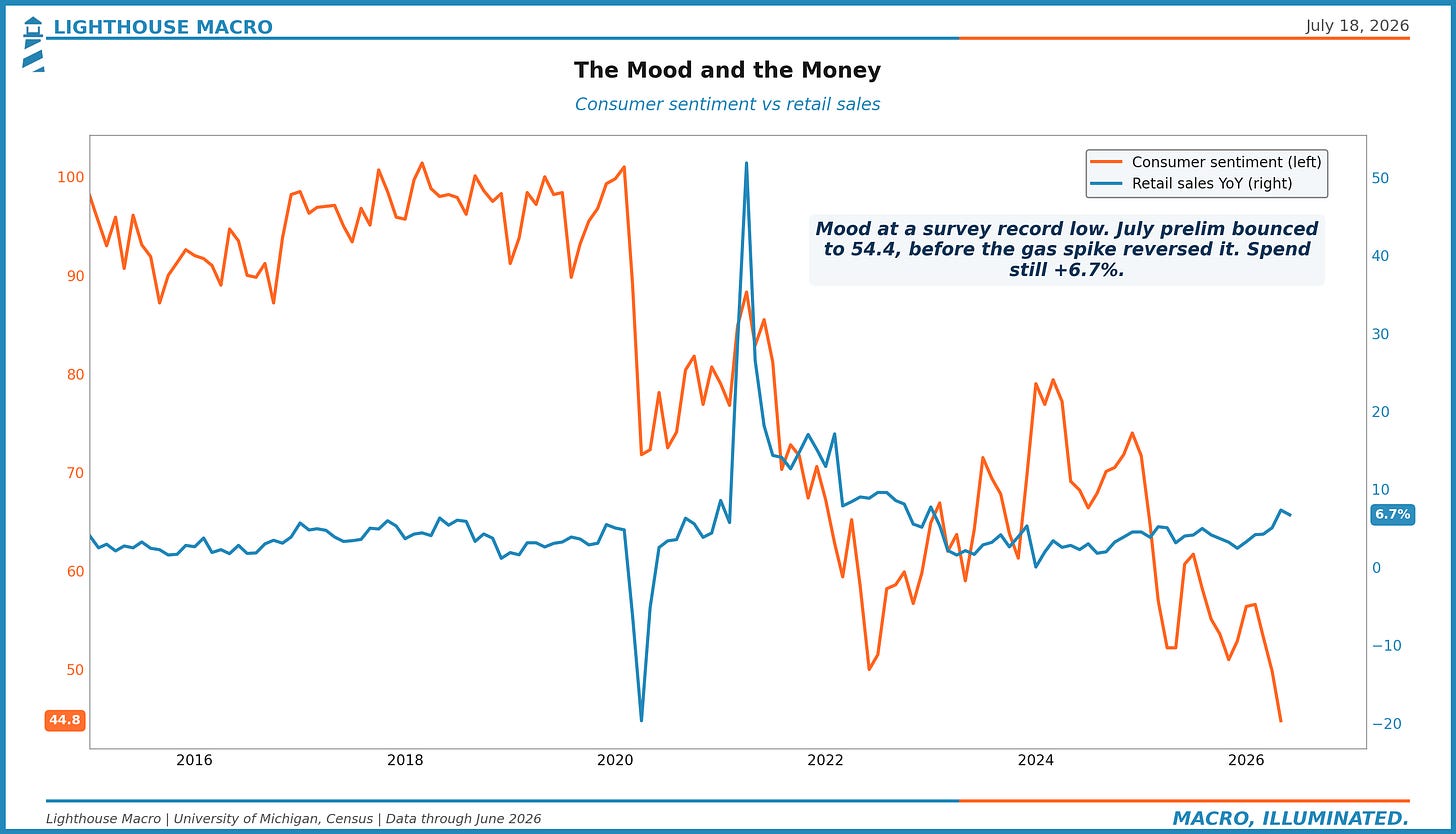
The mood and the money disagree. Retail sales are strong in nominal dollars while consumer confidence spent May at the lowest level since the survey began in 1952. The banks say the consumer is fine. We think fine is doing a lot of work in that sentence.
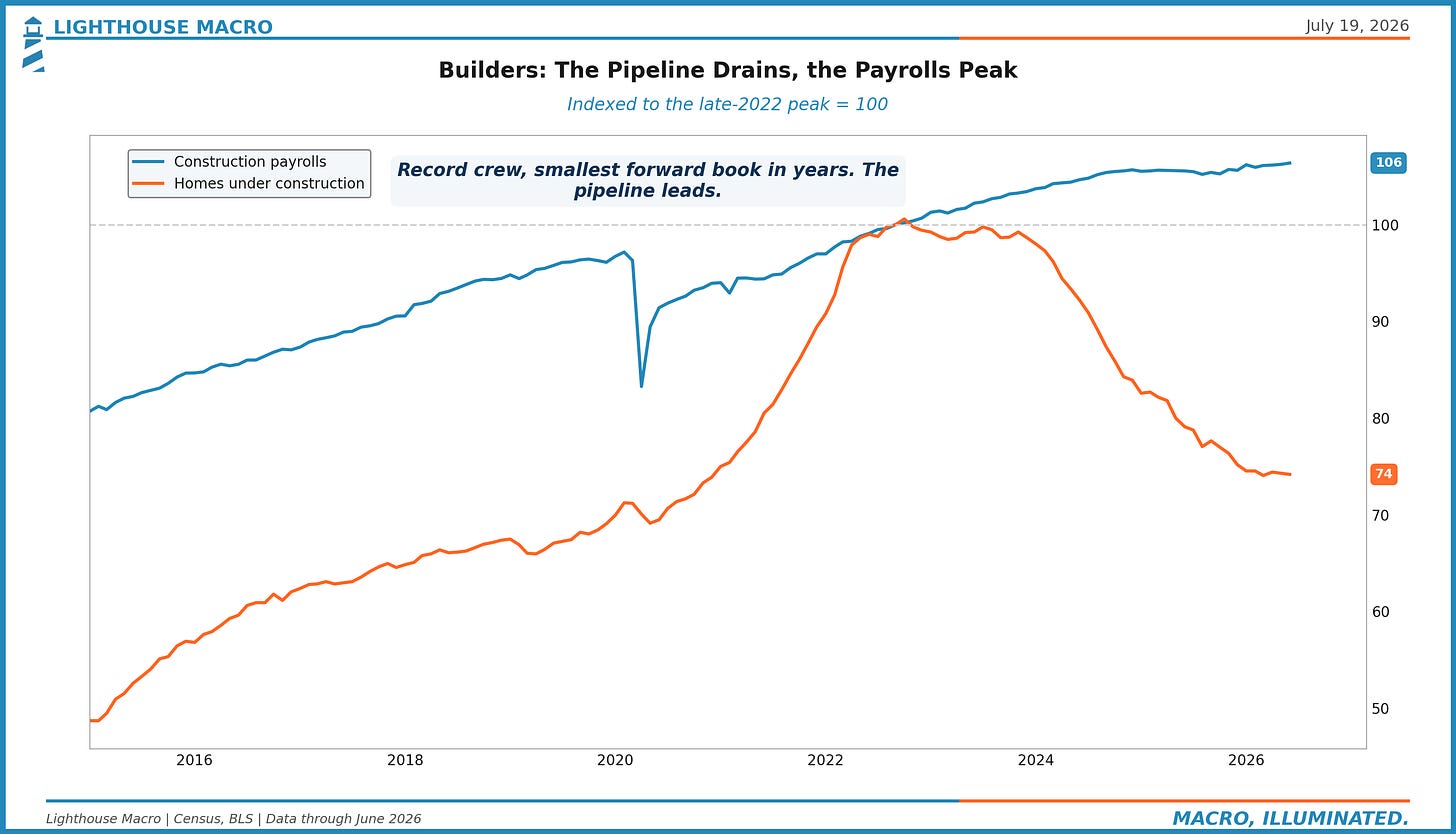
Housing looks stable and the pipeline is gone. Homes under construction are down a quarter from their peak while construction payrolls sit at a record high.
Here is the question that matters: why would six unrelated corners of the economy all develop the same two-speed structure at the same time? Each seam has its own local story. Tariffs opened the inflation gap. Concentrated AI capex built the second engine. The 2022 rate shock froze the housing pipeline. Deficits stretched the term premium. None of those started this year. What changed is the regime that used to close the seams. For fifteen years a reflexive Fed backstop compressed credit spreads, cushioned the bottom cohort, capped the term premium, and stood behind every wobble, so gaps like these narrowed before anyone had to price them. That reflex is gone. The new chair has said, in about as many words, that the put is not his job, and fiscal policy is issuing into the vacuum it left. The gaps are local. That they persist, and that not one of them is closing, is the regime. The term premium is just the place where the market says it out loud.
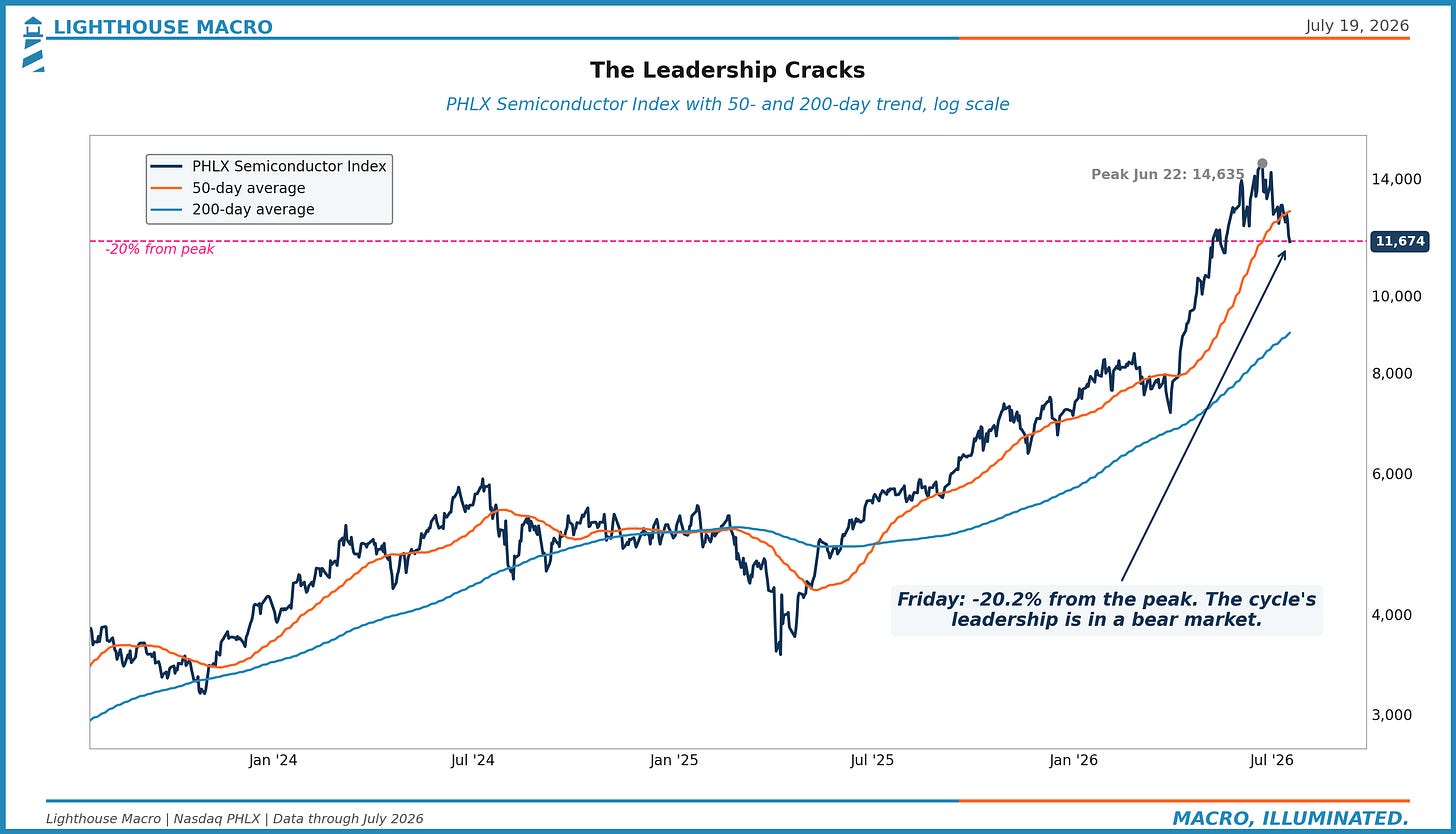
Friday gave a preview of how fast the tape can start to care. The S&P fell 1% and closed below its fifty-day. The VIX jumped 12% to 18.8. The semiconductor index, the leadership of the entire cycle, closed more than 20% below its June peak, a bear market by the conventional definition. One down day proves nothing, so we file Friday under texture. The instructive part was which corner of the market led the move.
Below is the full read, thread by thread, and how we are positioning for what comes next.
EXECUTIVE SUMMARY
Every number on the surface this month came in somewhere between fine and strong, so this summary skips the surface and goes straight to the mechanism under each print.
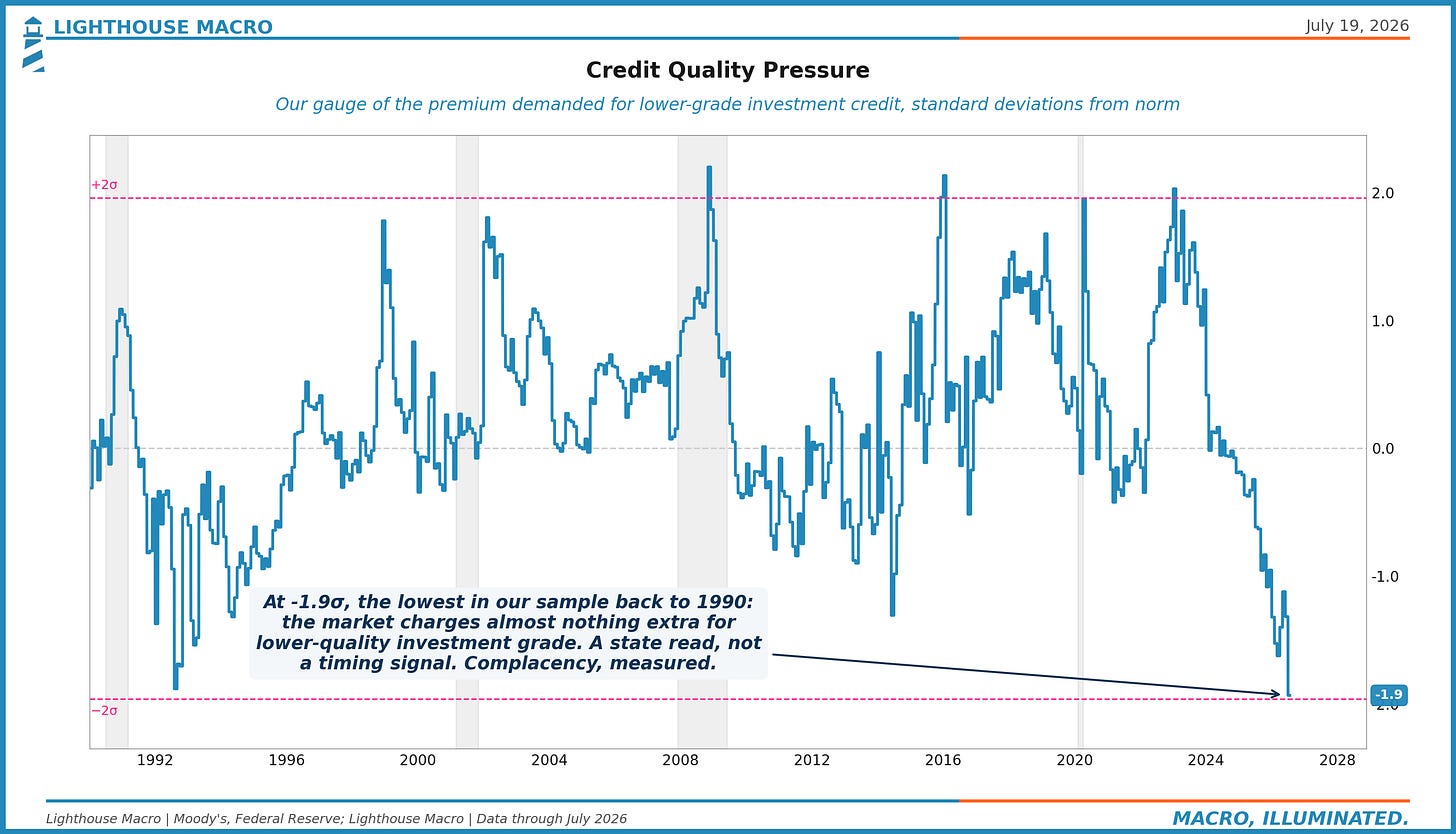
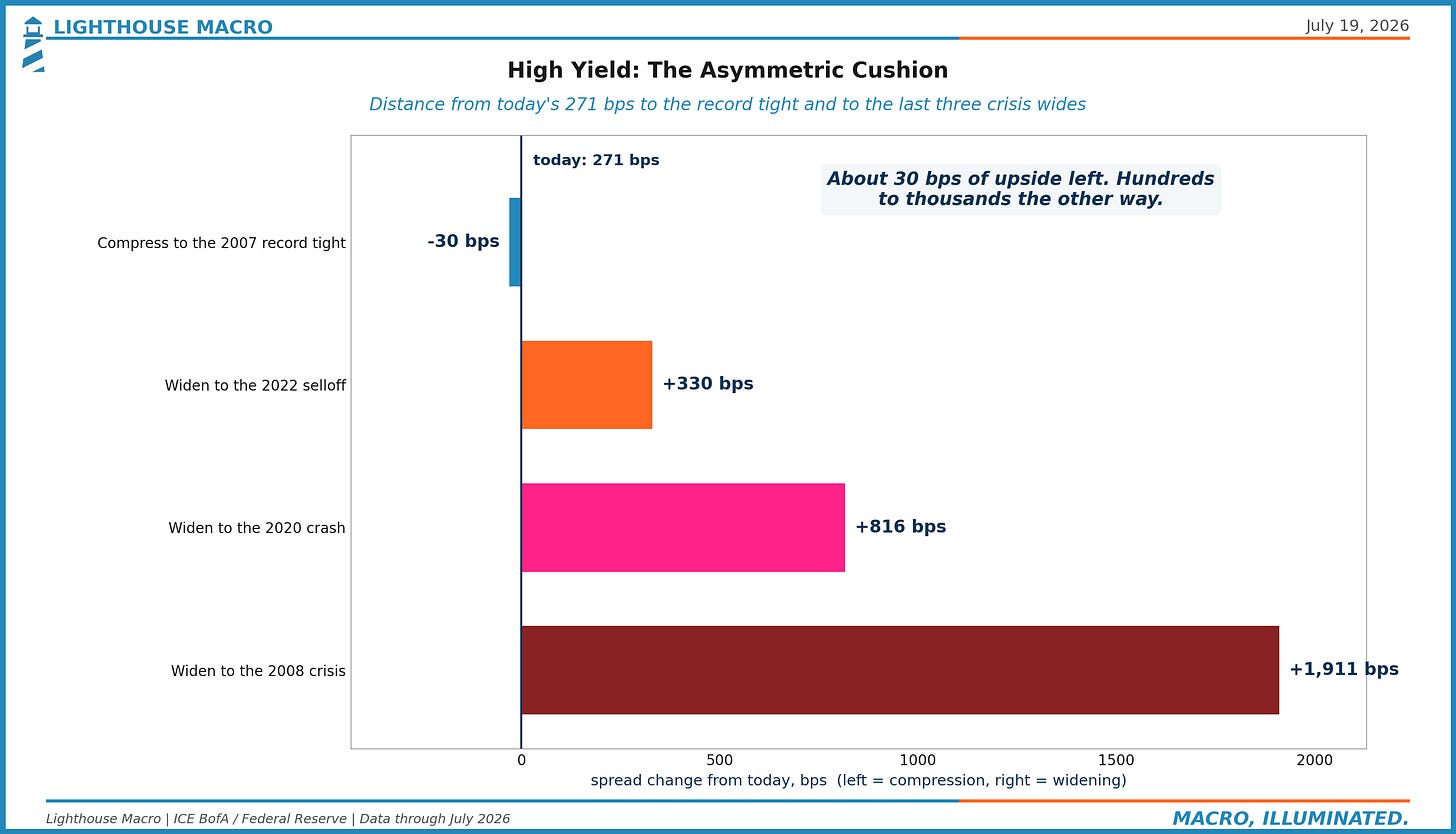
Under the calm credit tape: from 271 basis points, high yield spreads have about 30 bps of room left to their all-time tight and several hundred to nearly two thousand to their historical wides. The remaining reward is a rounding error against the remaining risk, and our Credit Quality Pressure gauge shows the premium for balance-sheet quality inside investment grade at its lowest reading since the sample began in 1990. The market has stopped charging for the difference between strong and weak.
Under the benign core CPI: import prices accelerating from zero to almost 7% in six months, producer prices running 5% to 10% depending on where in the pipe you measure, and a core goods CPI that is still decelerating anyway. Historically those series move nearly together. The current gap means margins are absorbing the difference, and that resolves one of two ways, through earnings or through the register.
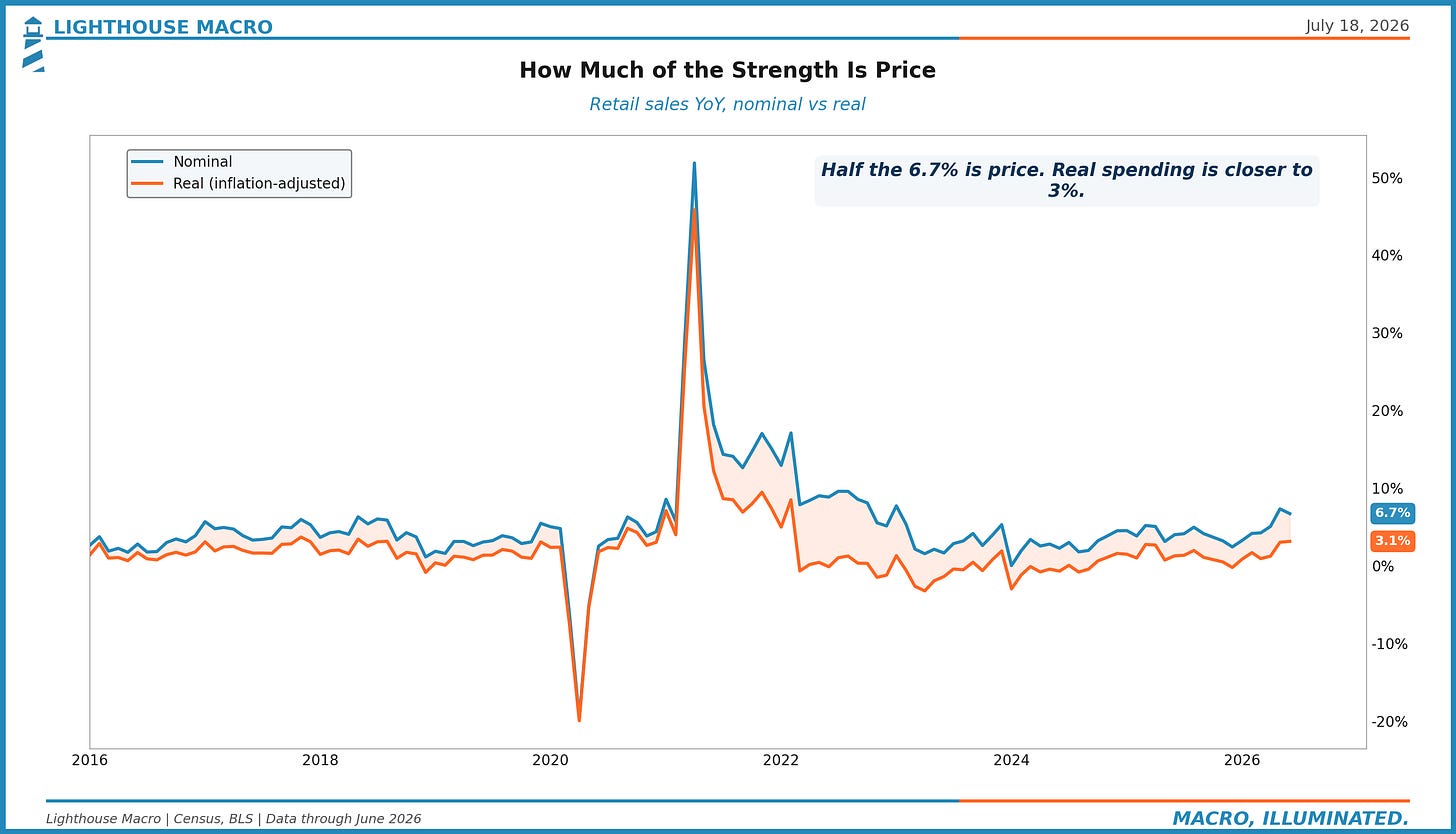
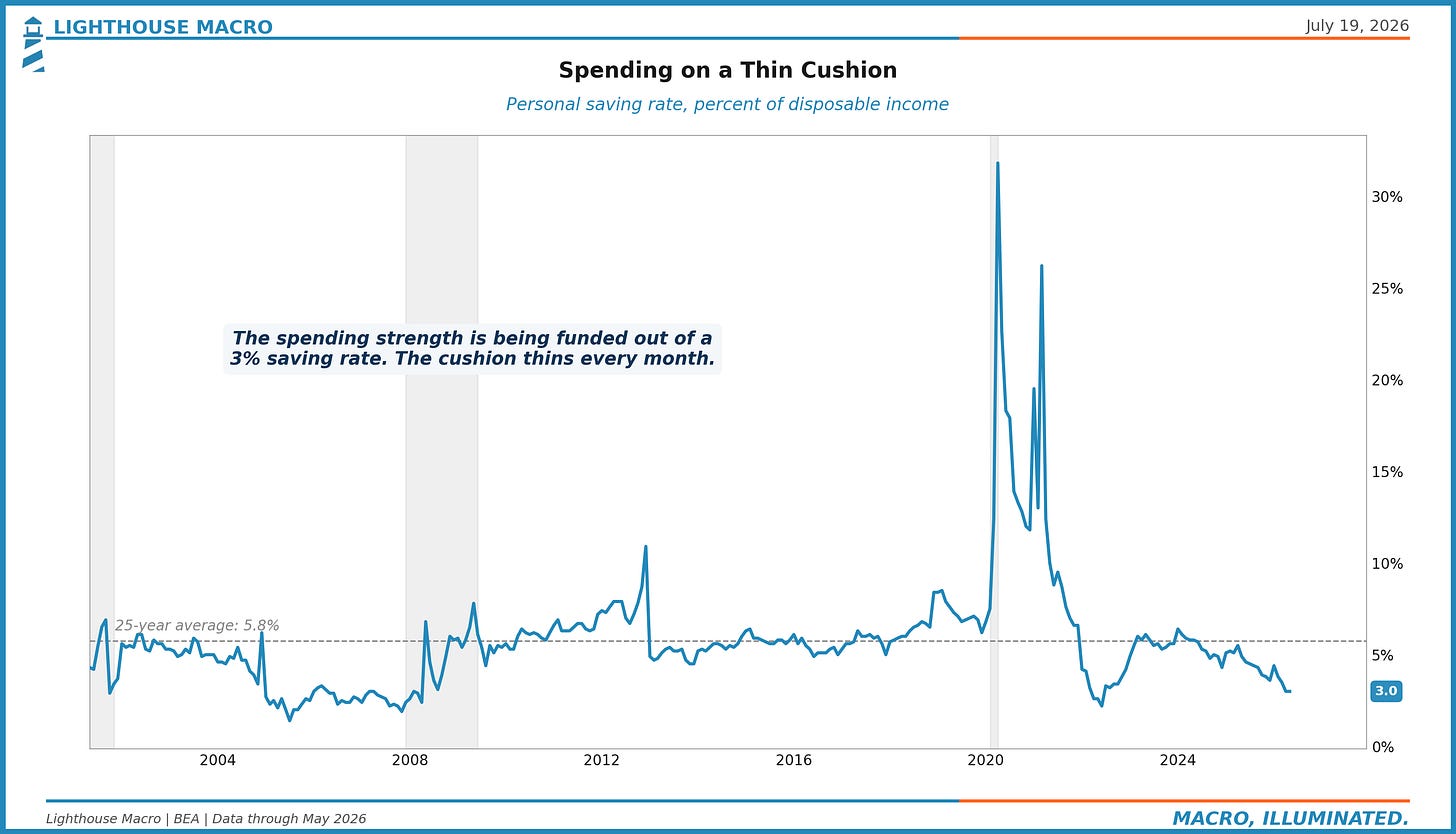
Under the strong retail sales: a nominal number closer to 3% in real terms, funded out of a 3% saving rate, sitting next to a confidence reading that touched a 1952-series low in May. The July sentiment bounce was powered by falling gas prices, and most of the survey closed before crude turned back up. The banks reported benign consumer credit and record profits, and we take that seriously as evidence against us. We also notice the split shows up in what people buy and how they feel before it shows up in what they fail to pay.
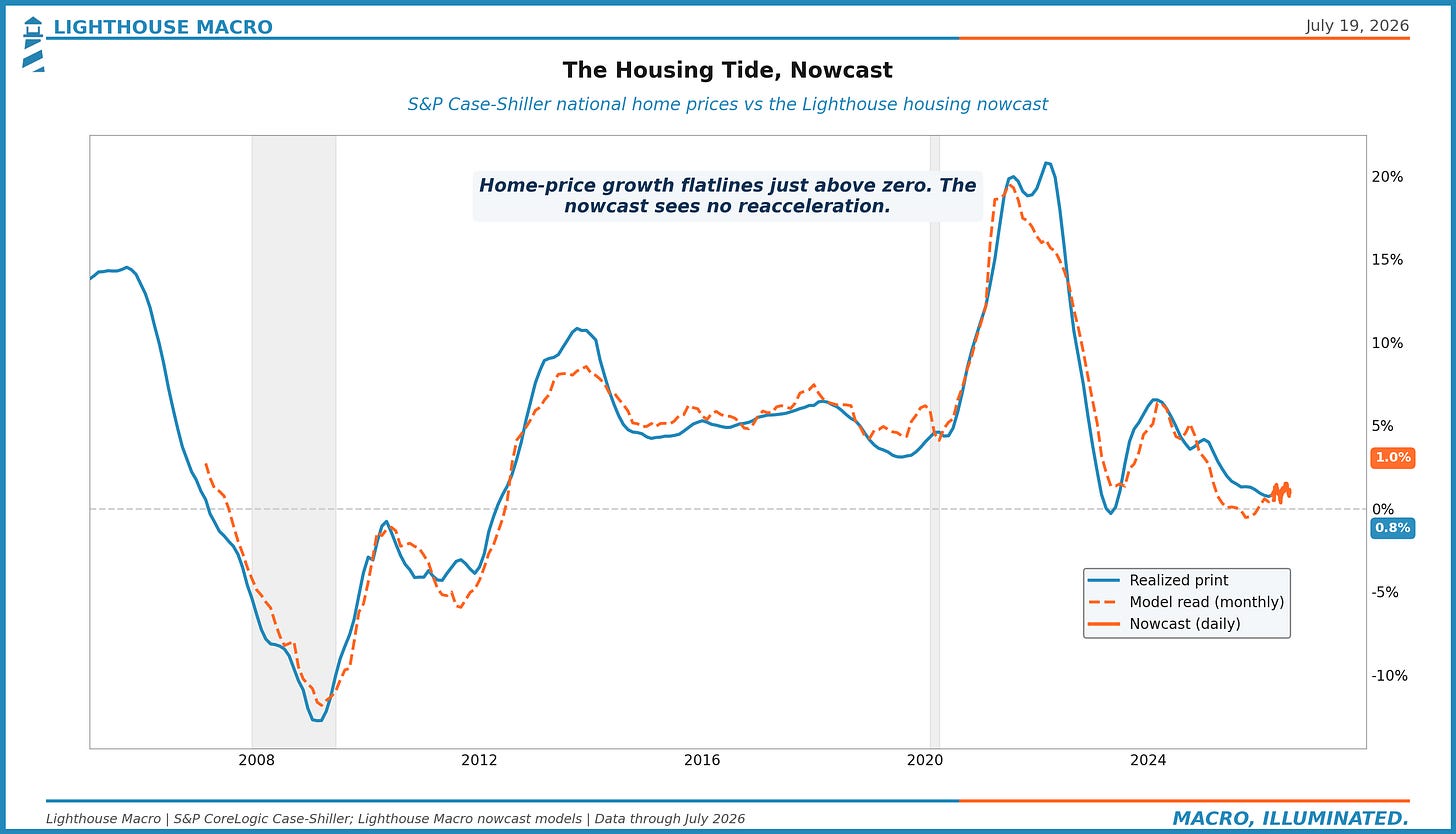
Under the housing starts rebound: a June jump that was entirely apartments. Single-family starts fell. The forward pipeline of homes under construction is down 26% from its 2022 peak and still draining while construction payrolls sit at a record, a gap that history closes in one direction. Our housing nowcast, the most accurate model we run out of sample, has price growth flatlining near 1% with no reacceleration in sight.
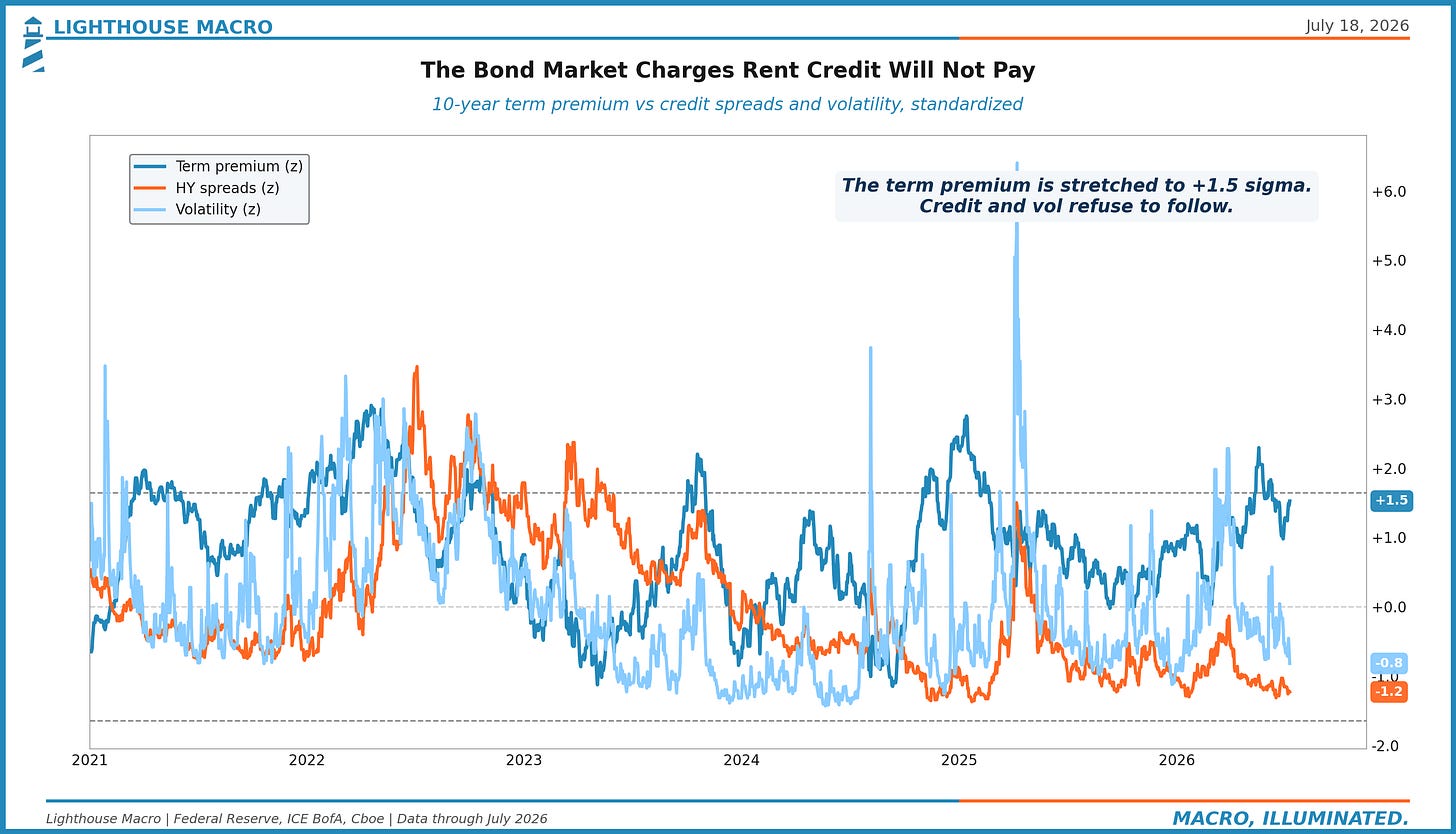
And over all of it: a 10-year term premium near the top of its two-decade range while credit spreads and equity volatility price a world with no fiscal risk at all. Two markets, one fiscal picture, priced in different currencies.
Net assessment: two-speed everywhere, one force underneath, and a posture built to participate without pretending the calm is structural.
SIX THREADS, ONE FORCE
1. The Bond Market Is Charging Rent Again
If the through-line is right, somewhere in the price system a market should be saying so plainly. One is.
The term premium on the 10-year Treasury, the extra yield investors demand to hold duration rather than roll short paper, sits at roughly 78 basis points on the NY Fed’s ACM model. The 20-year average is 29. Today’s level puts it near the top decile of the last two decades, and it has held in that neighborhood since the spring. Outside the current cycle, you have to go back to April 2011 to find the term premium this high. And for years at a time in the decade between, the number was negative. Investors paid for the privilege of holding duration, because a reflexive central bank stood behind the market and the belief in that reflex was itself the collateral.
That is the regime that ended. The current chair spent his confirmation season telling anyone who would listen that the Fed put is not a policy instrument, and the June meeting backed the words with dots. Meanwhile the fiscal engine issues into the long end at a pace that assumes a buyer of last resort who has left the room. The term premium is what it costs to hold duration in that world, and the bond market has been quietly repricing it while the louder markets kept trading the print.
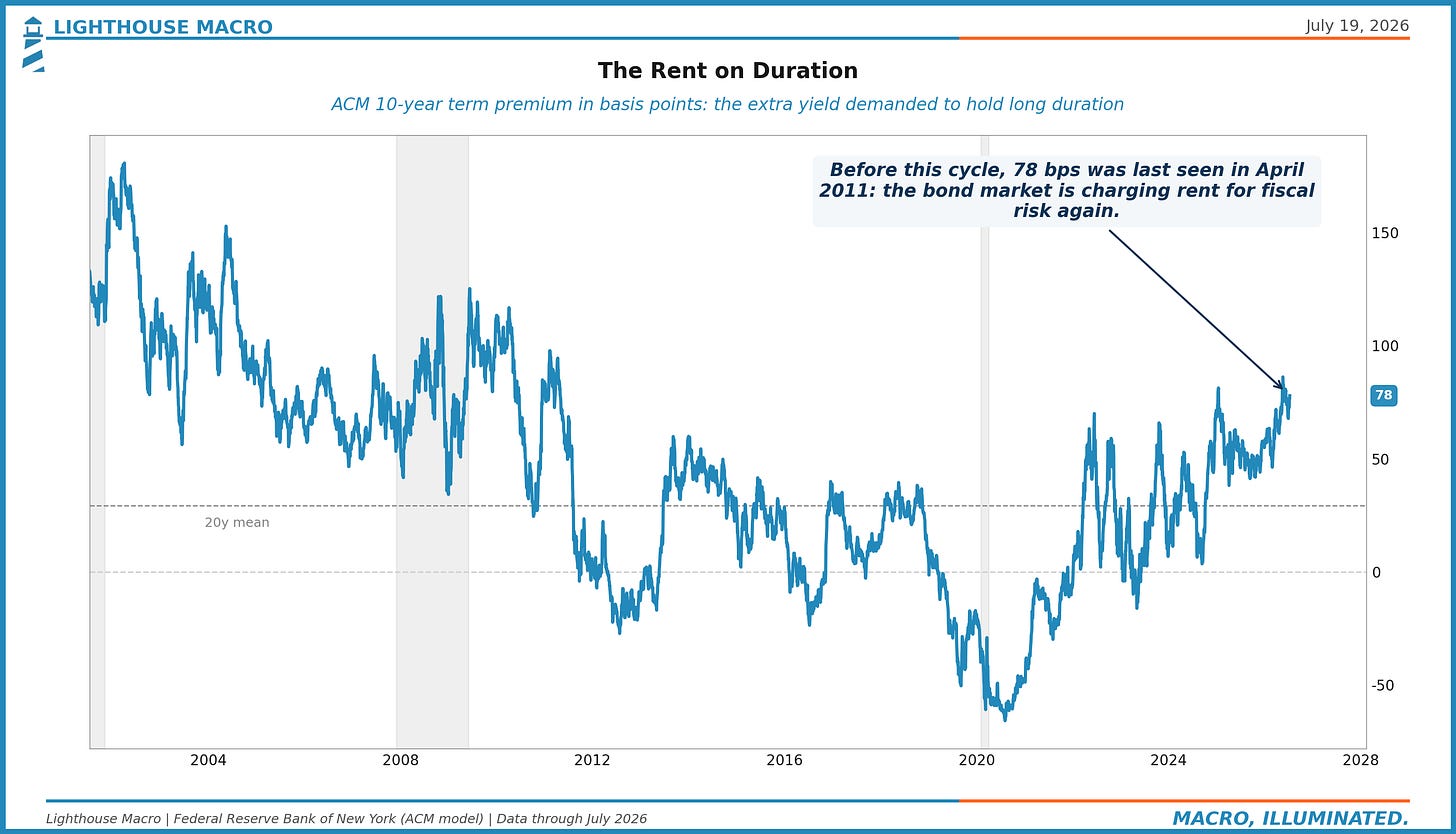
We keep coming back to one comparison. The rates market has restored a rent on duration that sits near two-decade highs. Credit spreads and equity volatility, which look at the same fiscal arithmetic and the same chair, price none of it. That is the divergence the rest of this report keeps finding, one pillar at a time.
2. Credit: Priced for Perfection
Credit is the cleanest example of a calm surface with the risk hiding in the geometry.
High yield spreads closed the week at 271 basis points, the bottom 4% of the last thirty years. Investment grade sits at 78, the bottom decile. And the compression runs all the way through the quality stack. Our Credit Quality Pressure gauge, which tracks the premium investors demand for the lower rungs of investment credit, sits at the lowest reading in a sample that runs back to 1990, nearly two standard deviations below its long-run norm. Not only is credit as a whole priced for perfection, the market is charging less for the difference between a fortress balance sheet and a leveraged one than at any point in thirty-six years. That is what late-cycle complacency looks like when you measure it.
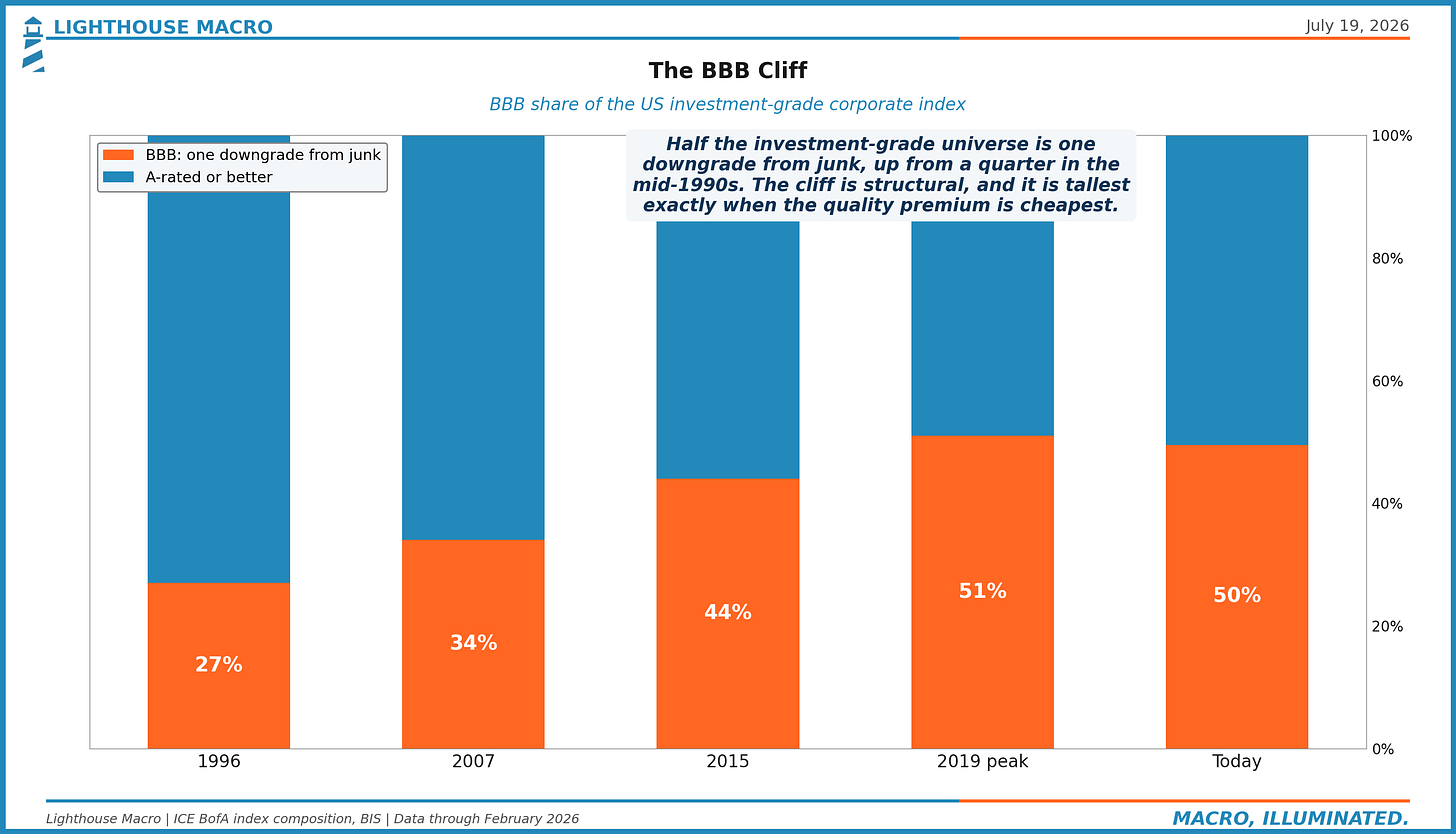
The structure underneath makes that complacency more expensive than it used to be. Half of the investment-grade universe now carries a BBB rating, one downgrade from junk, up from about a quarter in the mid-1990s. The tightest quality premium in thirty-six years is being charged on the tallest cliff.
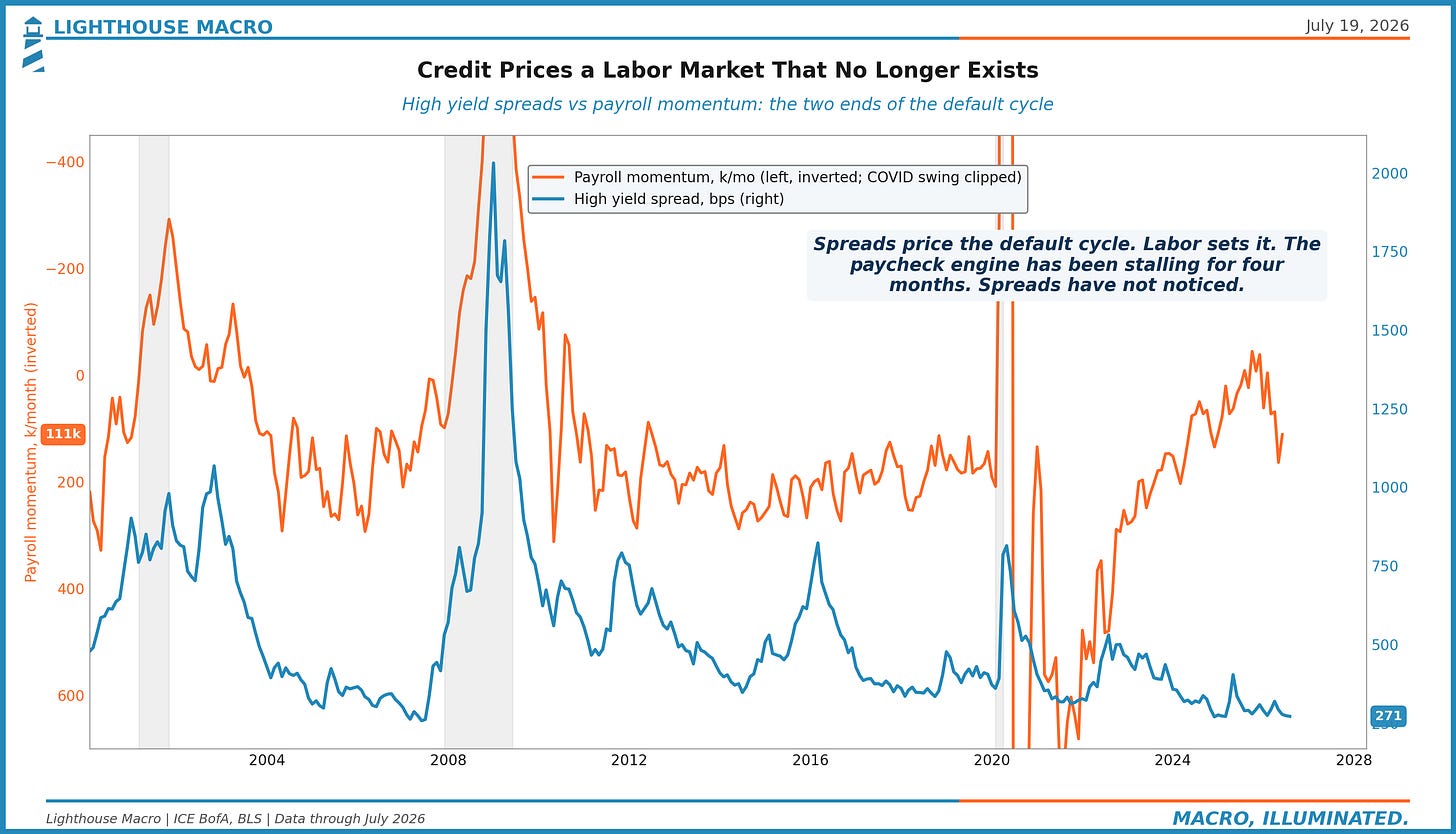
Now the geometry. From 271, the all-time tight is 241, set in the summer of 2007. So the entire remaining prize for perfection actually arriving is about 30 bps of compression. The other side is not symmetric. The 2022 selloff took spreads to roughly 600. COVID took them past 1,000. The 2008 wide was near 2,200. Thirty basis points of upside against three hundred, eight hundred, nineteen hundred of downside. You are not being paid to hold this. You are being paid to hope.
The honest counterargument is carry. Hold high yield here and you clip a couple hundred basis points of excess income a year while nothing happens, and nothing can happen for a long time. Tight spreads have stayed tight for years at a stretch before. Carry is a real income stream right up until the thing it was compensating for shows up, and the rest of this report is about whether that thing is approaching. With the default cycle’s driver already stalling, we would rather let someone else collect it.
A fair objection: the term premium and the credit spread price different risks, and they can coexist. They have before. On the first of June 2007, the day high yield set its all-time tight of 241, the ACM term premium sat at 78 basis points, almost exactly where it sits today. We are not dodging that fact. We are underlining it, because it may be the most instructive one in this report. The last time the market priced this exact combination, an elevated rent on duration next to record-tight credit, was the summer before spreads went to 2,200. The configuration can persist, 2007 proved that. What 2007 also proved is what it tends to precede. Credit does not have to match the term premium basis point for basis point. It has to reckon with the world the term premium is describing, heavy issuance, sticky inflation, no reflexive backstop, and it has not started.
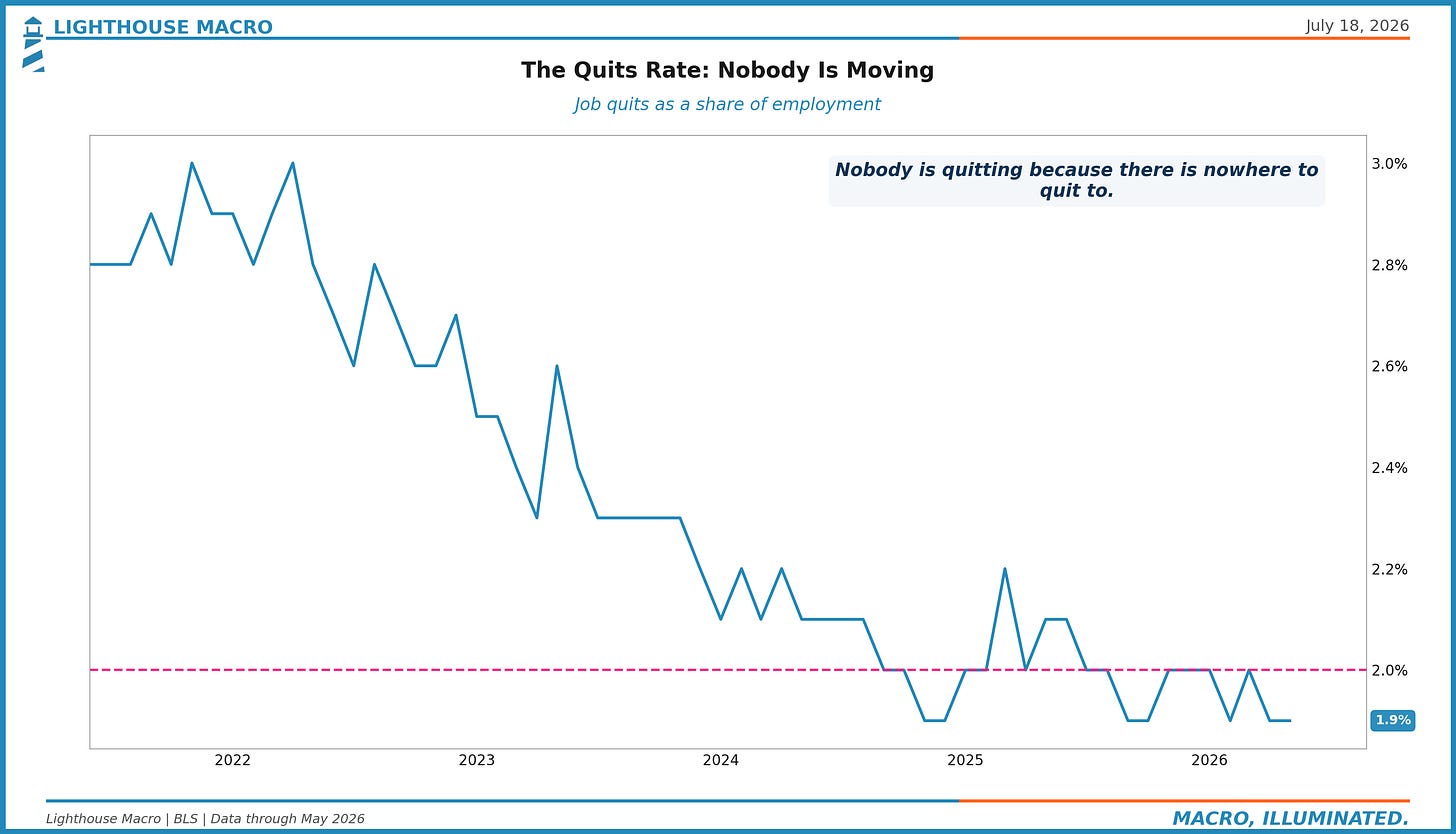
And then there is labor. Spreads price the default cycle, and the default cycle runs through the paycheck. Income stress becomes delinquency becomes default, in that order, every cycle. Payroll growth has gone 214,000 to 57,000 since March and the quits rate printed 1.9%, at or below the 2.0% caution line for most of the last two years. Credit at 271 bps is pricing a labor market that no longer exists. The chart below is the whole argument in one picture, and it is the relationship we would put on the wall this month.
3. Inflation: Hot Upstream, Quiet Downstream
Core CPI is running about 2.6% year over year. Calm, above target, not accelerating. The kind of number that lets consensus keep telling a disinflation story.
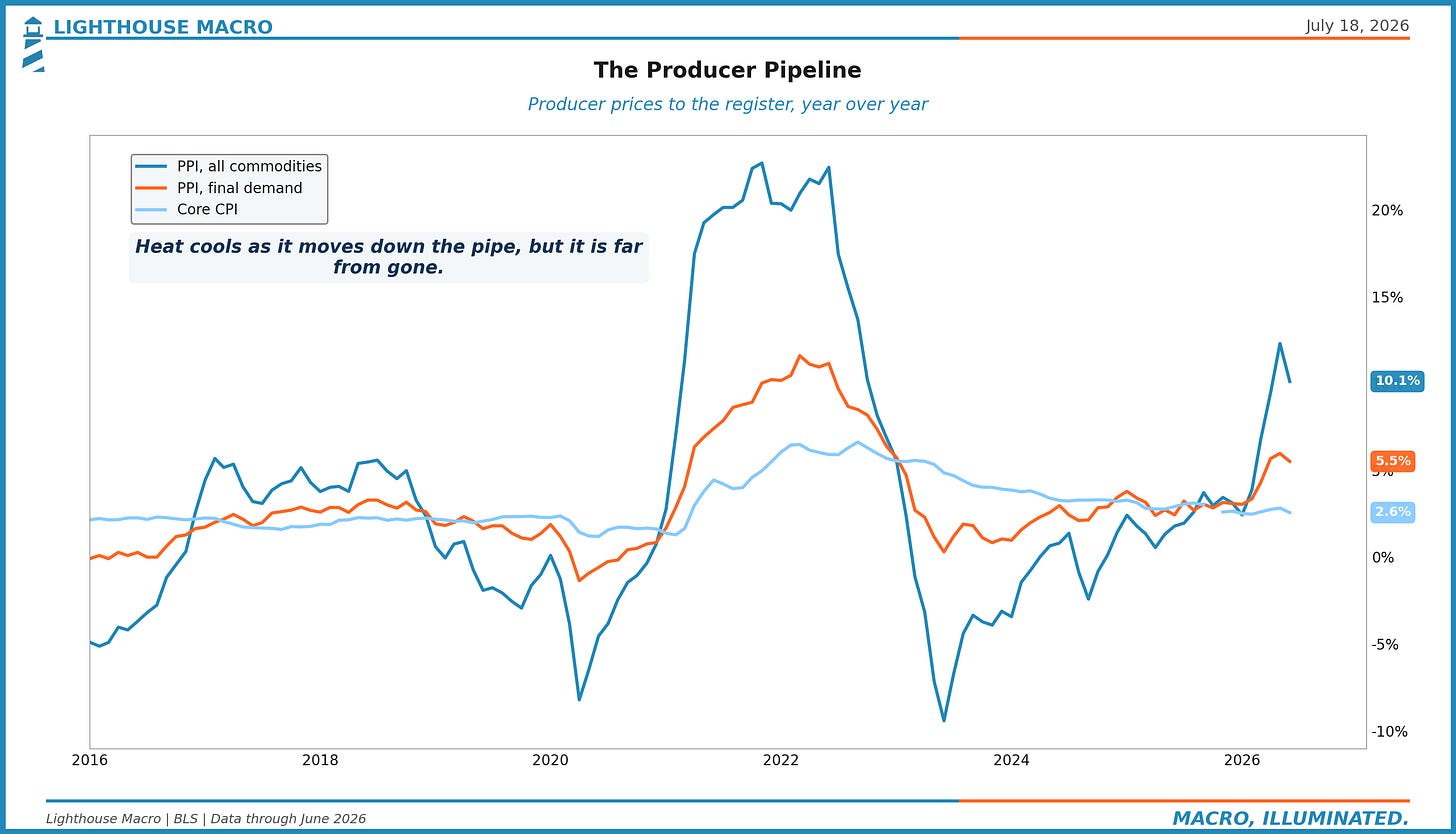
Walk up the pipe and the picture changes. Import prices were flat year-over-year in December. By June they were up almost 7%, with the sharpest steps coming in the spring as tariff pass-through hit the invoice line. Producer prices tell the same story from a different window, final demand up 5.5% and the all-commodities index up 10%, even after both eased off their May peaks. The NY Fed’s global supply chain pressure index has swung from negative territory to well above normal this year. The stuff that becomes the stuff on the shelf is getting more expensive, quickly.
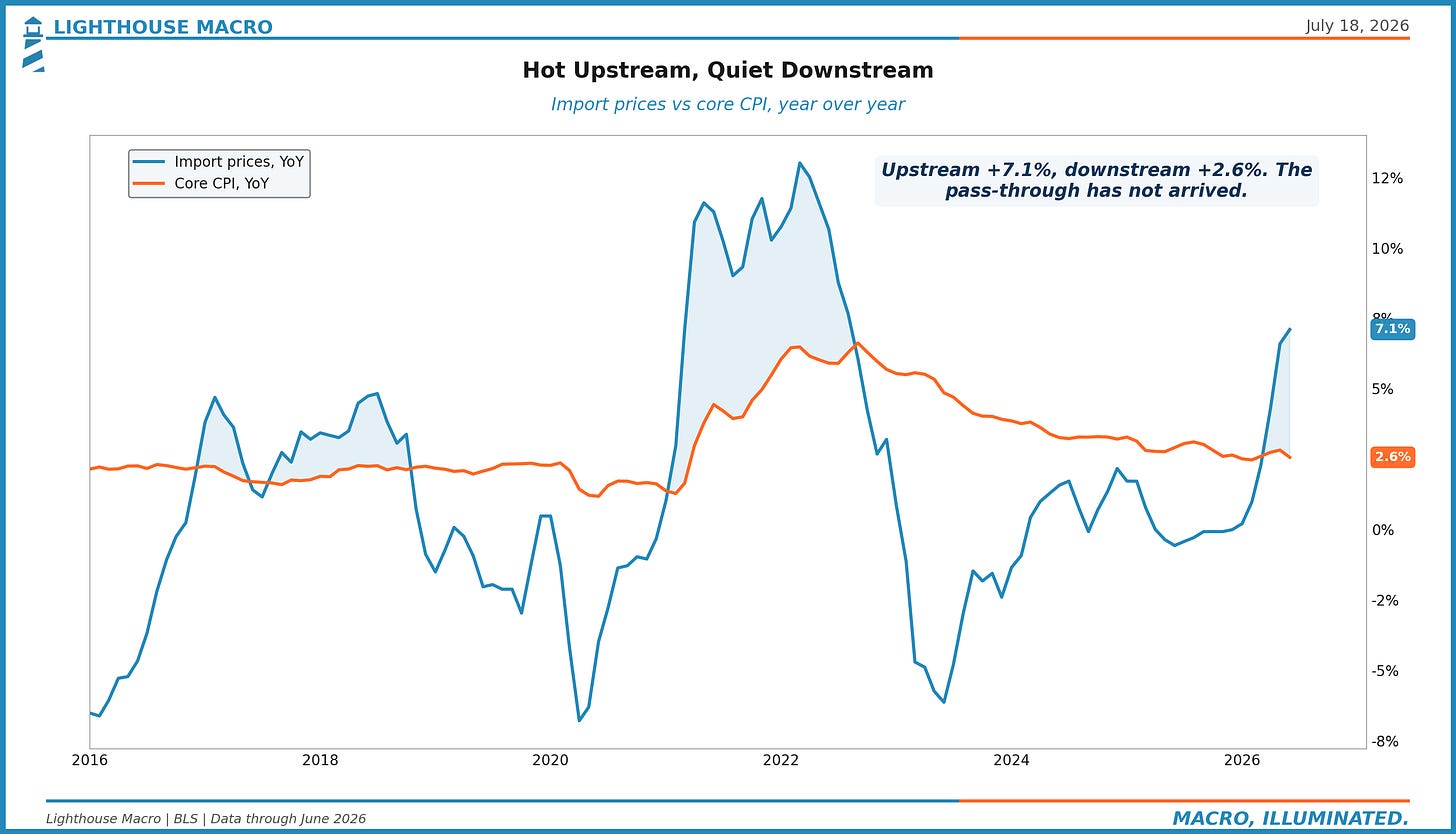
Here is the part that makes it interesting rather than obvious. Core goods CPI, the downstream landing zone for all of that, is still decelerating, up less than 1% and slowing through June. Import prices and core goods CPI never move one for one. Imports are a slice of the consumption basket, firms pass through only part of what they pay, and the historical relationship is loose. But it is directional, it works with little lag, and right now the two are six points apart. Some of that wedge is composition. The rest is margin, firms paying tariff-inflated invoices and not yet charging the register for them. Gaps like this close one of two ways. Margins keep absorbing it until earnings show the bruise, or the register catches up and the disinflation story loses its best evidence. Either exit lands on a market priced for neither.
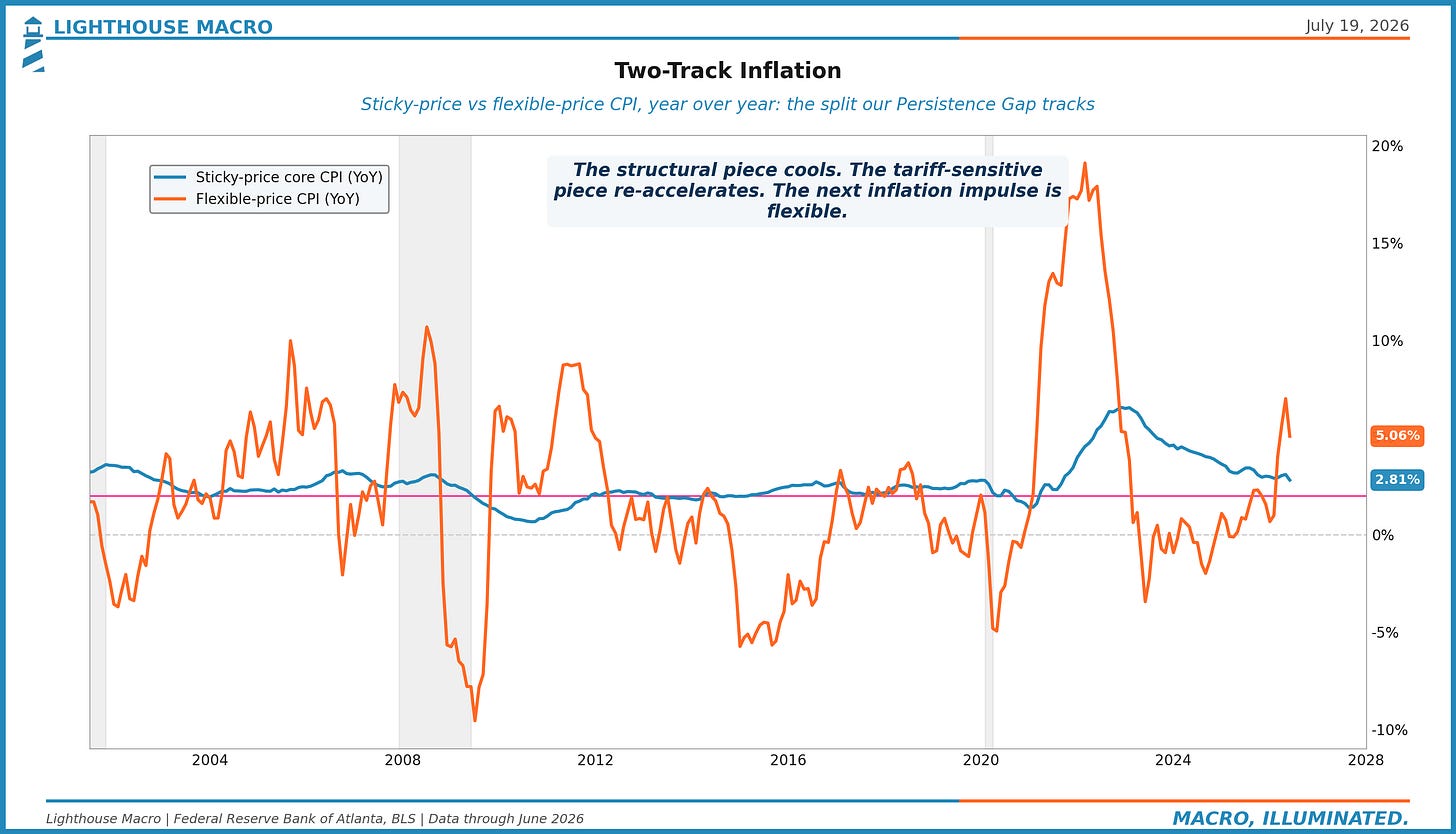
Our Persistence Gap points the same direction from inside the CPI itself. The gauge tracks the split between the sticky part of the index, the slow-moving, wage-and-rent-driven prices that define where inflation settles, and the flexible part, the fast-moving prices that catch new shocks first. Sticky inflation has cooled to 2.8%. Flexible inflation is running at 5.1%, and that is after easing from a May spike near 7. That configuration says the structural fever is easing while a new impulse works its way in from the fast-moving edge, which is exactly what tariff pass-through should look like in its early innings. The next inflation problem, if it comes, arrives through the flexible lane.
4. Two Engines: The Economy Builds, the Paycheck Stalls
This is the thread our nowcasts flagged before we went looking, and it deserves the fuller telling.
The engine that builds is genuinely hot, and the evidence is current. Semiconductor production is running just over 20% annualized on the last three months through June. Core capital goods orders, the standard forward read on business investment, are up more than 10% year over year through May. The first quarter’s GDP detail showed real equipment investment growing at a 15.8% annualized rate, and while that figure is a quarter old, the fresher orders and chip data say the impulse carried into summer. Capital is being committed, at scale, to the future-facing corner of the economy.
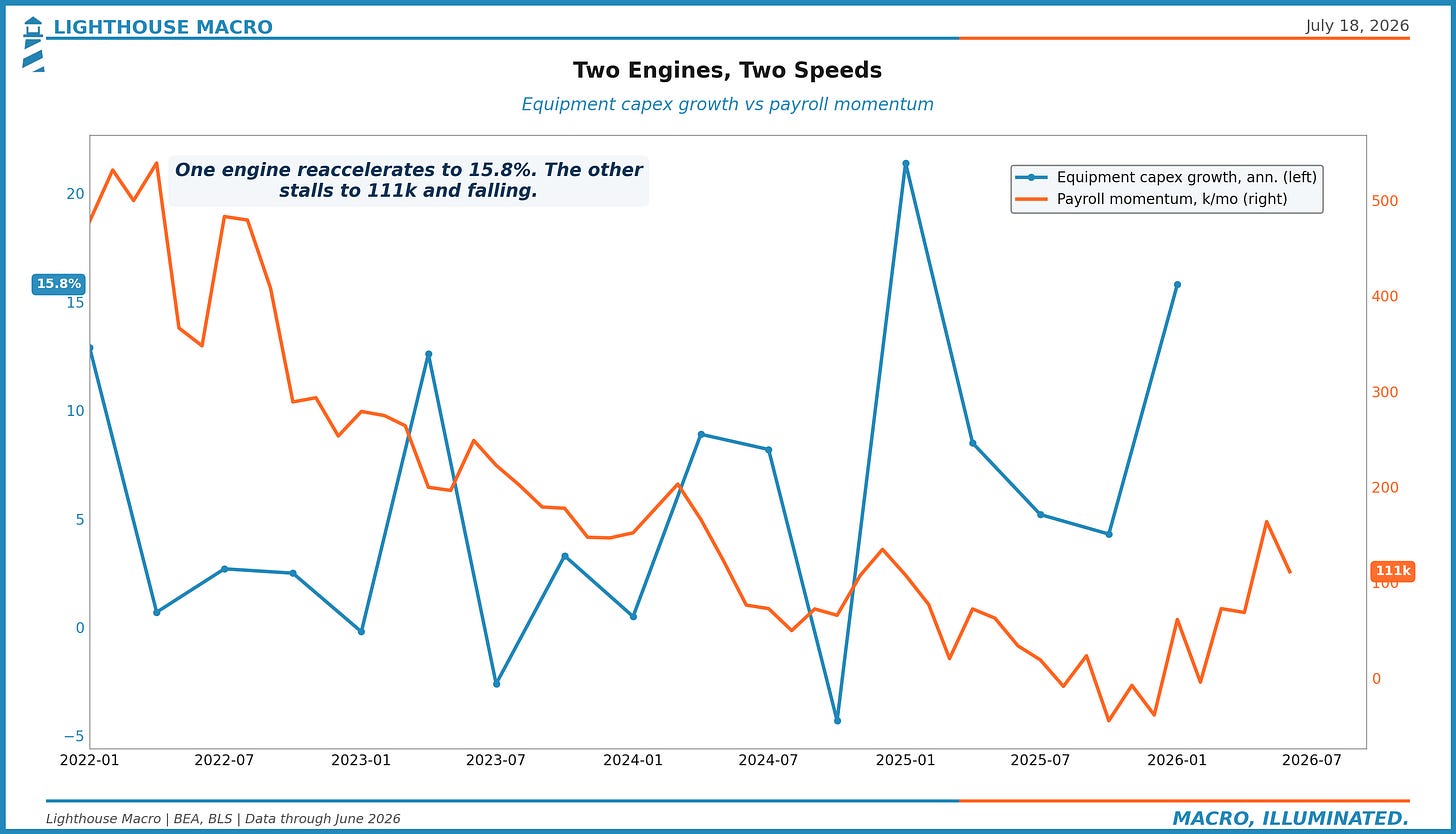
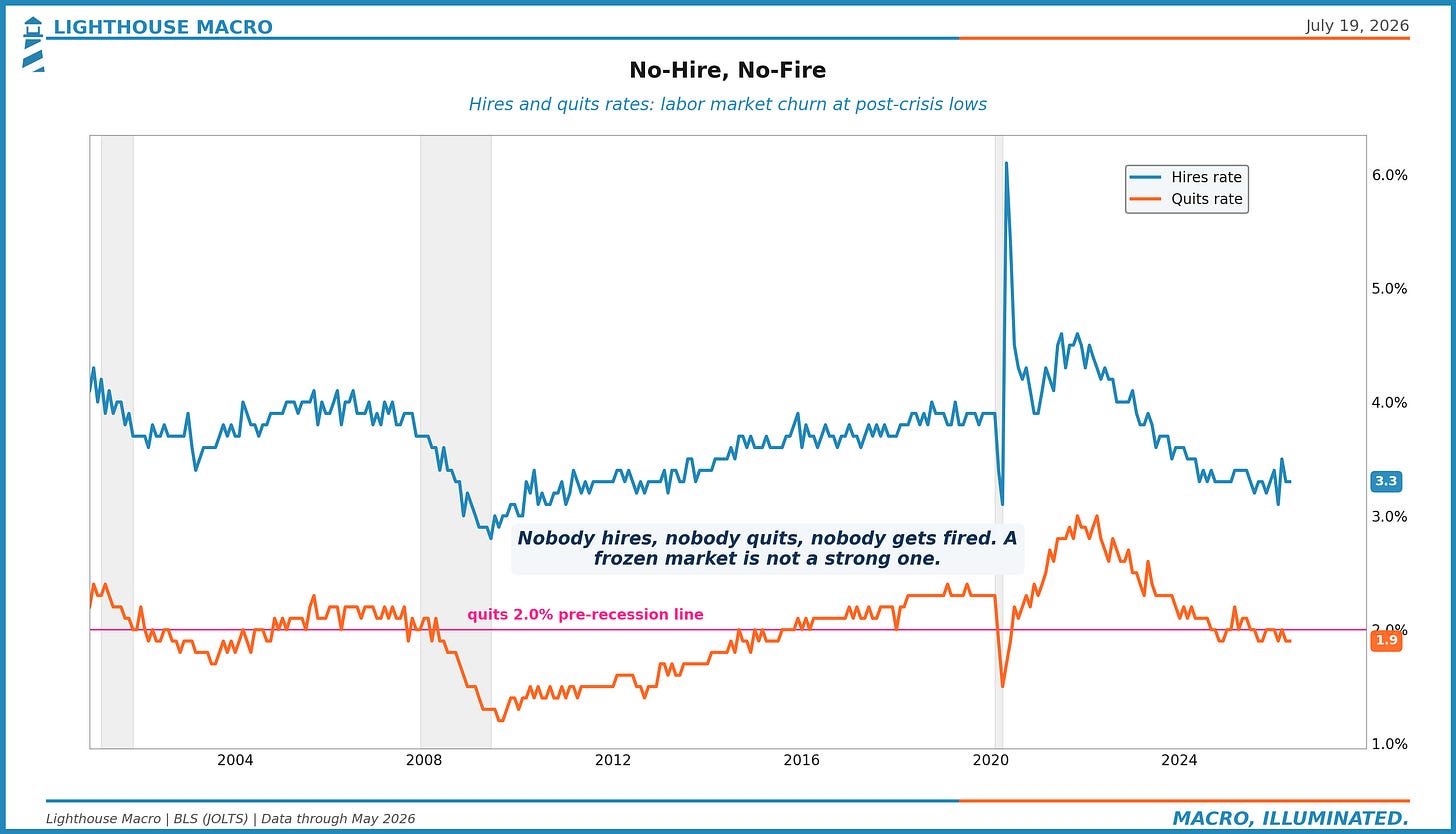
The engine that earns is stalling. Payroll growth has fallen from 214,000 in March to 148,000, then 129,000, then 57,000 in June. The three-month average is 111,000 and falling. And underneath the headline, the churn that makes a labor market healthy has simply stopped. The quits rate printed 1.9% in the latest data and has now spent eighteen of the last twenty-four months at or below the 2.0% line we treat as the caution zone. The level has never timed anything on its own, and the last two years prove it. What it measures is how much shock absorber the market has left. People are not quitting because there is nowhere to quit to.
Our own models frame the freeze better than any single series. The labor nowcast we run leans on claims and hiring-adjacent market data, and it currently reads far healthier than the payroll prints themselves. That gap is the diagnosis. Claims are low because firing has stopped. Payroll growth is dead because hiring has too. The mundane reading is that the model is simply miscalibrated to a frozen regime, and maybe it is. But it is miscalibrated in an informative way: its inputs are the same low claims the soft-landing case leans on, and they cannot see the hiring freeze either. A no-hire, no-fire market photographs well from either angle and is fragile from both, because an economy that has stopped churning has no shock absorber left. The first quarter that forces layoffs meets a labor market with no natural re-entry flow.
Why it matters: the market is wired to the engine that builds, and households live on the one that earns. A capex boom concentrated in chip fabs does not put money in the median paycheck. Consumption, 68% of the economy, runs on the engine that is stalling.
5. Two Economies: The Mood, the Money, and What the Banks Said
The consumer looks strong if you only look at the till. Retail sales rose 6.7% year over year in June. Strip out inflation and real spending is closer to 3%, and part of the wedge between those numbers is the same war-driven energy price that crushed the mood, the two halves of this thread share a cause. All of it is being funded out of a saving rate that has been ground down to 3.0%. The strength is real. It is also thinner than it looks, and it has no buffer behind it.
Sentiment tells the other half. Consumer confidence hit 44.8 in May, the lowest reading since the survey began in 1952, as war-driven gas prices bit into paychecks. July’s preliminary print bounced to 54.4, the best since February, and the survey’s own commentary is candid about why: pump prices eased. It is also candid about the catch. More than 70% of the July interviews were completed before July 7, when strikes on Iran resumed. Crude turned higher within days, and the pump-price relief that lifted the mood was already reversing as the survey closed. We would not lean on that bounce.
Now the banks, because honesty requires it. We expected the money-center earnings to show the bottom cohort fraying into the credit data. They did not. All four majors printed benign to improving consumer credit. JPMorgan called delinquencies better than expected across FICO bands and cut its card loss guidance. Citi’s card book released reserves. Bank of America’s CEO went on television to say lower-income deposits and wages are catching up. That is real evidence against the two-economies read on its shortest horizon, and we log it as such.
Here is what we notice anyway. Credit performance is the last domino in every consumer cycle, by construction. Stress shows up in what people buy and how they feel long before it shows up in what they fail to pay. The mood is at recession levels for the cohort that lives paycheck to paycheck. The mix is shifting, with earnings coverage of the card businesses showing branded spend growing double digits while private-label store cards, the lower-income corner of the complex, shrink. And the same JPMorgan call that dismissed the K-shaped narrative flagged, in the next breath, a cohort of consumers in negative real wage growth heading toward distress. The banks are telling you the loans are fine. The paychecks are a different conversation.
Two economies, both true at once, because they describe different people. If you sell to the median household, the mood, the mix, and the 3% saving rate are telling you more than the retail headline is.
6. Builders Stopped: The Pipeline Is Gone, the Payrolls Are Not
Housing threw off a blowout headline this month. June starts jumped 19% to 1.43 million. Keep reading and every bit of the gain was multifamily. Single-family starts, the number tied to a family deciding to buy a home, fell on the month and are down more than 3% from a year ago. The apartment surge is a rental-supply story. The buyer demand story got worse.
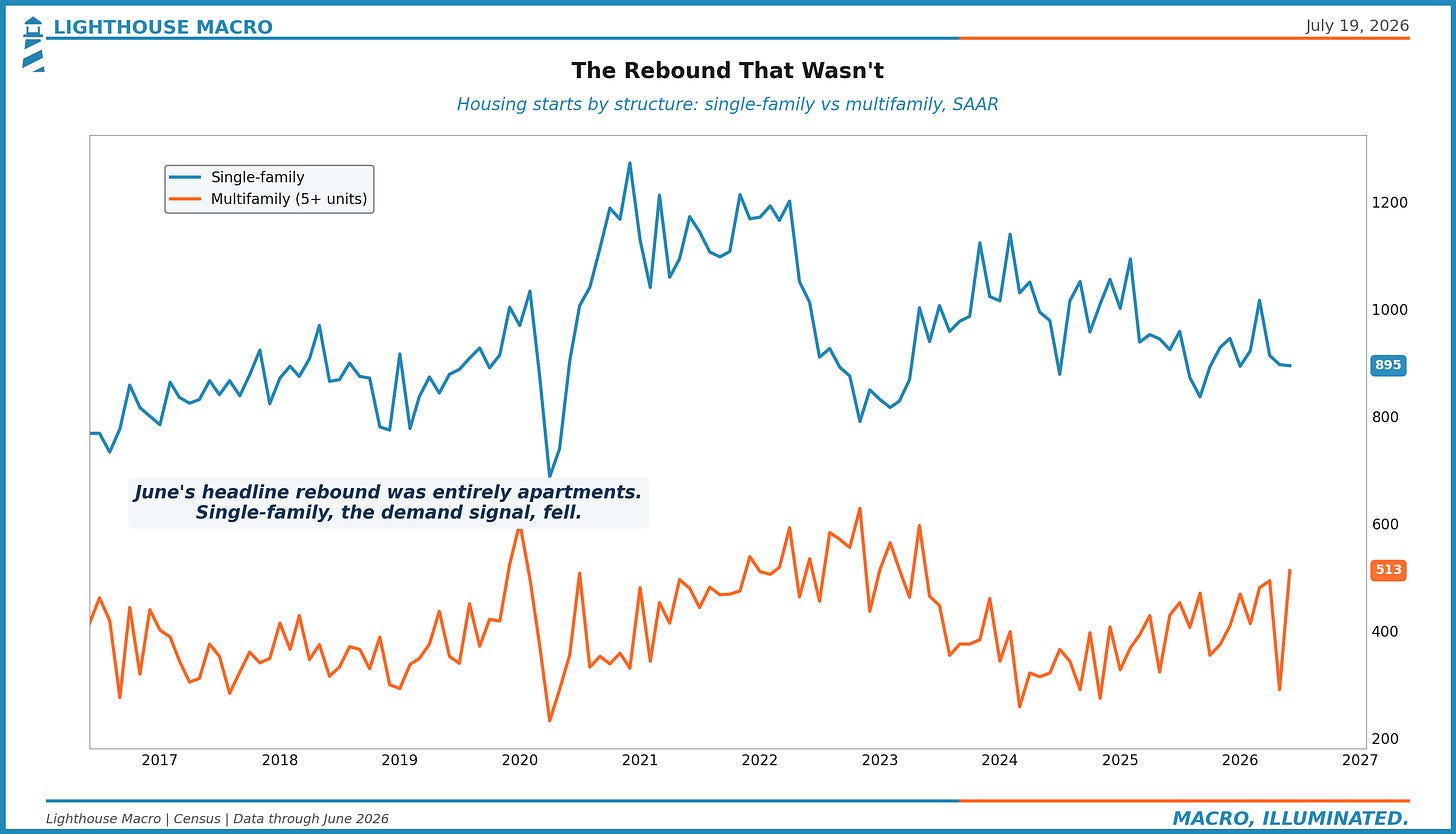
The real signal is the scissors between the pipeline and the payrolls. Homes under construction, the forward book of the entire industry, are down 26% from their late-2022 peak and still falling month over month. Construction payrolls just set a record at 8.33 million. Builders are carrying the most workers they have ever carried against the thinnest forward book in years, while new-home months of supply sits at 10.3, a level this century seen only in the 2008-09 wreckage and one month of 2022. You do not keep a record crew employed against a pipeline that has drained a quarter of its volume. Either building turns back up soon, or the payrolls come down to meet the pipeline. History says the pipeline leads.
Our housing nowcast agrees. It maps daily housing-adjacent data onto national home prices and it is the most accurate model we run, explaining nearly ninety percent of the variation out of sample. Its current read: price growth flatlining around 1% with no reacceleration building anywhere in its inputs. A frozen market, priced flat, carrying a labor overhang it has not paid for yet. Housing is where the two-speed structure has already reached the late innings, and one more place the paycheck engine eventually inherits the problem.
What Friday Was, and What It Wasn’t
We are deliberately not building the thesis on one down day. But Friday deserves its paragraph, because of which corner of the market did the moving.
The S&P fell 1.0% to 7,458, two percent off its June 2 record, and closed just below its fifty-day average, something it also did in late June before recovering. The VIX jumped 12% to 18.8 from 16.7, more of a stretch than a break. On their own, unremarkable. The tell was leadership. The semiconductor index closed 20.2% below its June 22 all-time high on Friday, tipping past the conventional bear-market line, and it led the tape down. When the single most crowded, most momentum-priced, most cycle-defining group is the first thing sold, the selling has a signature. The market is starting, tentatively, to reprice the corner where the perfection assumption was strongest. That is texture, not proof. It is also exactly what the early innings of our scenario would look like.
HOW WE’RE POSITIONING
When the surface and the mechanism disagree this widely, the move is to position for the mechanism while the surface still lets you do it cheaply. Participate where the data pays, stay defensive where it does not, and keep powder for the moment the two reconcile.
Own quality while it costs nothing. The credit section is the argument in miniature. When the market charges almost no premium for balance-sheet strength, quality is the cheapest it ever gets relative to what it protects. We would rather own the balance sheets that do not need a benign world than the ones priced for it. Up in quality, up the capital structure, no reaching.
Anchor in defensives that do not need the paycheck engine. The labor thread says the earnings side of the economy is stalling. Defensive equity exposure that does not hinge on payroll growth reaccelerating is the ballast, and health care remains the clearest version of it.
Lean into where upstream inflation surfaces first. Producer prices for intermediate goods are running double digits, and the input side of the food chain is one of the places that pressure historically reaches earliest and most durably. Agribusiness gives us a cyclical with that current at its back, and it is where we have added. Tariff regimes cut both ways for the sector, retaliation hit farm exports hard in 2018, so the expression is input-cost-led, sized as a cyclical, and it carries a stop like everything else.
Keep dry powder, and keep it earning. Cash is a position. Short-duration bills pay while they wait, and Friday was a reminder of how quickly optionality gets valuable. If the crack widens, that is the ammunition.
Stay light where perfection is priced. The corners that lead a tape lower when volatility wakes up are the rate-sensitive, momentum-priced ones, exactly the corner that cracked first on Friday. Where we hold cyclical exposure, it carries a stop, and the stop is a price. When a position breaks its trend we cut it, thesis intact or not. Price is the arbiter.
No leverage into this tape. The point is to be positioned for the mechanism, sized to sleep, and liquid enough to move when the gap closes.
KEY MONITORING SIGNALS
The quits rate. Pinned at 1.9%, eighteen of the last twenty-four months at or below the 2.0% caution line. A decisive break lower moves the labor read from stalling to pre-recessionary. The next JOLTS print is the most important number on the calendar.
Credit spreads, both directions. High yield holding under 300 while labor softens keeps the divergence alive and makes the eventual repricing more violent. A move toward 350 to 400 while labor keeps deteriorating is the reconciliation arriving. Either resolution tells us something.
The nowcast split. Either industrial production reaccelerates to meet the 4% GDP read, or GDP comes down to meet the goods economy. The split our models flagged this month has to close, and which side closes it decides whether this was a soft patch or a turn.
The import-to-core pass-through. Core goods CPI is still decelerating under an import price line that has gone from zero to 7%. Watch the next three CPI prints and the Q3 margin guidance in the same frame. One of them absorbs the gap.
Single-family housing, and only single-family. Ignore the multifamily-driven headline. Watch single-family permits and the under-construction pipeline. If the pipeline keeps draining, construction payrolls are living on borrowed time.
The term premium and the long end. If the term premium holds near two-decade highs and credit finally follows it wider, the two markets reconcile and the reconciliation is risk-off. If 10-year yields break higher on term premium rather than growth, read it as fiscal, whatever the headlines say.
Volatility and breadth follow-through. The fade so far lives in the short-timeframe internals, with the share of stocks above their 20-day average rolling from 71% to 58% while the 200-day version holds firm. That is a warning, and only a warning. If the long-timeframe breadth joins it under a near-record index, distribution is underway and Friday was the first chapter.
INVALIDATION CRITERIA
We hold strong views weakly. Here is what would change them.
The two-speed read breaks toward the good engine if payroll growth reaccelerates above 150,000 with the quits rate turning up, and the capex strength broadens beyond chips into the rest of industry. The banks’ benign credit books are already arguing this side, and if the labor flows confirm them, the stall was a soft patch and we will say so.
The credit call breaks if spreads widen to 350-plus while labor stabilizes, repricing the cushion without the deterioration that makes the gap dangerous. A rebuilt cushion in a stable economy is a healthier setup, and a less interesting thesis.
The inflation-pipeline thread breaks if import prices roll over and core goods CPI keeps decelerating without margins showing the strain. Upstream heat that dissipates without reaching either earnings or the shelf was a scare, and we will retire it.
The regime thread breaks if the term premium falls back toward its old range while issuance stays heavy. That would mean the market has decided the backstop is not gone after all, and the keystone of the one-force read weakens accordingly.
Friday was noise if the S&P reclaims its fifty-day, the VIX settles back under 17, and semiconductor leadership stabilizes within a couple of weeks. It did exactly that in late June. Texture cuts both ways, and we said it was texture.
THE BOTTOM LINE
The hardest thing to do in a tape like this is hold two ideas at once. The headline economy is fine. The economy underneath it is running on two engines at two speeds, on a credit cushion that is nearly gone, on inflation that has not finished traveling up the pipe, on a household base splitting into the cohort that spends and the cohort that frays, and on a housing sector carrying record crews against a drained pipeline. Both are true. The gaps are local. The regime that lets them sit open is shared, because the mechanism that used to paper over the seams, the reflexive backstop, got taken away while the fiscal engine kept running. The bond market has been pricing that world all year. The term premium is the receipt. Everything else is still trading the print.
We are not calling a top. We are not calling a recession. The claim is narrower: the surface and the mechanism have drifted far enough apart that the gap itself is now the trade, and we would rather be positioned for the gap to close than for the calm to last. Quality while it costs nothing, defensives for ballast, the upstream-inflation current where it pays, powder dry, no leverage.
The calm was always a lag. On Friday, the lag got shorter.
That’s our view from the Watch. We’ll keep the light on...
Bob Sheehan, CFA, CMT
Founder & Macro Strategist
Important Disclosures
This document is for informational purposes only and does not constitute investment advice, a solicitation, or a recommendation to buy or sell any security. The views expressed are those of Lighthouse Macro and are subject to change without notice. Positioning language reflects our current thinking and is not a representation of any account’s holdings. References to Lighthouse Macro nowcasts and gauges describe proprietary models built on public data. Data as of July 17, 2026 unless otherwise noted, sourced from BLS, BEA, Census, the Federal Reserve, the Federal Reserve Banks of New York and Atlanta, ICE BofA, Moody’s, S&P CoreLogic Case-Shiller, Nasdaq, the University of Michigan, company filings, and the Lighthouse Macro Master Database.