The Second Round
Welcome back to Marginal Matters, the free series where we take one piece of research, sit with it, and walk it through our own data until it makes sense.
Don't navigate in the dark.
This week we visit the banks and the nonbanks again, because the first time around we only told you half the story.
The Money Runs Both Ways
A few weeks back we tracked money from the banks to private credit in One Step Removed. As banks shied away from certain loans, they started lending to the funds that make those loans instead, and the line on the Fed's H.8 for loans to nonbanks shot up to become the fastest-growing loan in the system. The best response to that piece came from Ian Harnett, co-founder of Absolute Strategy Research in London, and it pointed out something we brushed past: money flows both ways. Banks lend to nonbanks, yes, but banks and their dealers also borrow from nonbanks every night, in the trillions. And if a big enough corner of the nonbank world gets forced to sell quickly, the banks take a hit whether or not they ever lent it a dollar.
That one sounds weird the first time you hear it. How does a bank lose money on a fund it never lent to?
Nicola Cetorelli, whose work with Saketh Prazad was the backbone of Banking on Nonbanks, answered this question with Mattia Landoni and Lina Lu in a New York Fed staff report Ian pointed us to, called "Non-Bank Financial Institutions and Banks' Fire-Sale Vulnerabilities" (Staff Report 1057, March 2023). To boil it down, banks are exposed to fire sales that take place anywhere in the nonbank world, even in corners where the banks don't own any of what's being sold. Most of the losses show up in a second round, when the nonbanks that took the initial hit start selling too. And if you just look at the first round of losses, "conventional assessments of fire-sale vulnerabilities can be grossly understated," the authors wrote.
We took the authors' map to our own data, and then looked at what they left out intentionally, which happens to be the part that has grown the most since their data ends.
What a Fire Sale Actually Is
A fire sale is simply what happens when you're forced to sell now, at whatever price the buyer in front of you will pay.
Imagine a neighborhood where three families are moving out the same weekend and all of them put a couch on the lawn. Nobody needs three couches, so the price goes down. And here's the key: every other house in the neighborhood with the same couch just got slightly poorer without selling anything, because their couch is now worth what the last one went for.
Which in finance is close to literal. Many securities get marked to the last trade, so when a fund dumps corporate bonds, everyone holding those same bonds takes a loss on paper, the banks included, without pressing a sell button.
The paper sorts the nonbank world into 12 categories: life insurers, property and casualty insurers, money market funds, three types of mutual funds (stock, bond and hybrid), ETFs, mortgage REITs, broker-dealers, finance companies, hedge funds and pension funds. Using the Fed's Financial Accounts, the authors map how much each owns of eight types of assets, ranging from stocks and corporate bonds to bank loans and Treasuries, every quarter from 2007 through 2021. Then for each group they ask the same question in turn: if this group were forced to sell 1% of its assets, how much would US banks lose?
Round One, Round Two
Round one is the couch on the lawn: the group selling pushes prices down, and all the banks that own the same assets mark them down.
Round two is where things get interesting. All the other nonbanks that own the same things took hits too, and they react. A leveraged company like an insurer or a broker-dealer sells to restore its leverage to where it was, a fund sells because investors withdraw money after a bad spell, and that selling pushes prices down a second time, often in quite different assets, so the banks get hit from a direction they didn't see coming.
A better way to understand the mechanics is the authors' own example. Bond funds start selling, and the banks lose a bit on the municipal bonds they have in common with them. But the same funds also sell corporate bonds, which hits the life insurers that own lots of them. So the insurers start selling to restore their buffer, and some of what they sell is bank loans, which the banks own a good amount of. Round two.
Plug in the end-2021 balance sheets and the second round dwarfs the first. A 1% sale by bond funds hits the banks for $8.9 billion in the first round and another $68.6 billion in the second. For stock funds it's $1.2 billion, then $60.3 billion, and for pension funds $3.3 billion, then $52.8 billion. Across the paper's pairings, an average of about three quarters of the losses shows up in the second round. Interestingly, the groups that seem the most frightening in the first round aren't necessarily the ones that do the most damage overall. Finance companies, which mostly own bank loans, do the most direct damage, $22.3 billion, and less after that, because hardly anybody else holds what they own. Insurers are actually the hub carrying everyone else's selling to the banks.
The situation has also gotten worse. From 2007 to 2021 the second-round hit from bond funds grew about fourfold, while ETFs went from barely registering to fifth worst, largely because funds kept growing while staying just as intertwined with everyone else.
Two points are well worth the price of admission (still nothing). First, the authors cut their simulation off after the second round, and the reason is practically amusing: with their numbers, letting it run any further is explosive. Second, look at how little Treasuries matter in their model. Anywhere in the paper, the largest bank loss that runs through government bonds is less than a tenth of a percent of bank capital, because the model treats Treasuries as about the easiest thing to sell out there. Don't forget this point.
The Half the Paper Leaves Out
All of the above is about what everyone owns. The authors are clear that the model ignores the funding side of things, the selling that starts when depositors head for the doors or short-term lenders stop rolling their loans. Repo, the market where most of that short-term lending happens, never surfaces in the analysis, and neither does the basis trade. That's the other leg, and it's the one Ian's note was about. His point was that the official research underestimates how much banks depend on nonbank cash, and the data makes it easy to see why.
Repo is a pawn shop for bonds. You give them a Treasury, get cash, and the following day you buy the Treasury back for a bit more than you received, the bit more being the interest. Dealers, most of them owned by banks, do this every night on an outsized scale, and a large fraction of the cash on the other side of the counter comes from money market funds, where a lot of companies keep their idle cash, and maybe where you do too.
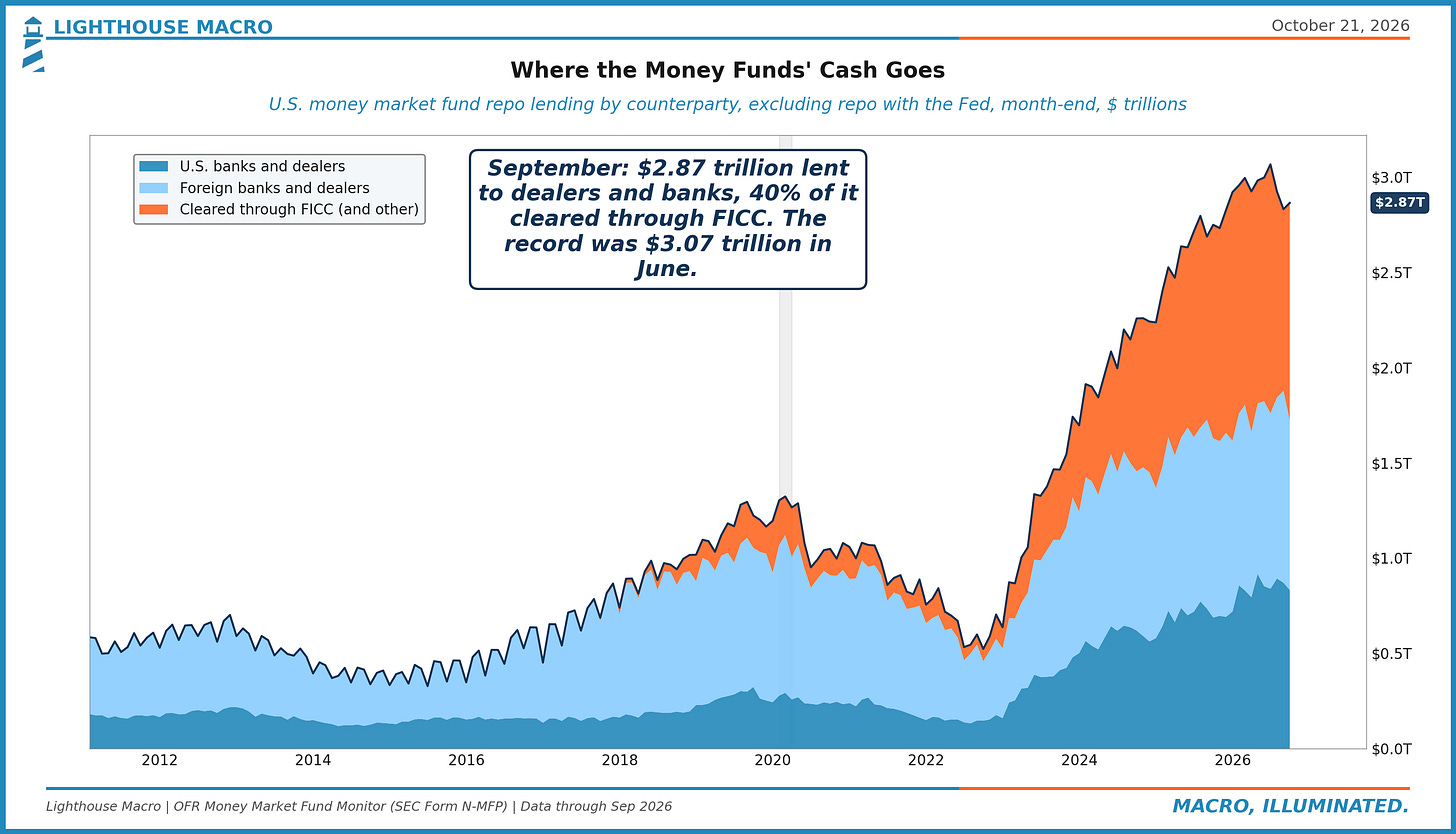
At the end of September, money funds had $2.87 trillion lent out in repo to banks and dealers: $833 billion to US firms, $890 billion to foreign ones, and $1.14 trillion through FICC, the clearinghouse for Treasury repo, most of it through an arrangement called sponsored repo. That last slice was basically nothing until 2017, and today it's about 10x what it was at the end of 2022.
The New York Fed's own economists traced the same plumbing in a repo series on Liberty Street Economics last month. Money funds are the primary lenders of cash in the market, their repo lending was around $3 trillion in January, nearly triple what it was five years earlier, and most of it heads to dealers, who pass a large amount on to hedge funds.
Cetorelli turns up a third time here, too. In a staff report this January with Viral Acharya and Bruce Tuckman, he put US banks' reliance on nonbanks at 13% of their funding. That count is a snapshot from early 2023, though, when money funds had about $1.0 trillion lent out in private repo, a number that has almost tripled since. Another 15% of bank funding sits with the rest of the world, in a bucket the authors couldn't split between foreign banks and foreign nonbanks.
The Trade in the Middle
Here's where much of that cash gets routed.
Large asset managers, the ones running bond funds and pension money, love holding Treasuries through futures, because it gives them the exposure without tying up the cash. That tends to push futures a bit above the underlying bonds, and hedge funds take the other side: they sell the futures, buy the real bonds, and keep both until the prices converge at expiration. The difference between the two is the basis, and by itself it's minuscule, a sliver of a percent, so they borrow to make it worthwhile, many times over, and they borrow in repo, with the bonds they just bought as collateral.
You can see both sides in the futures positioning data the CFTC publishes every week.
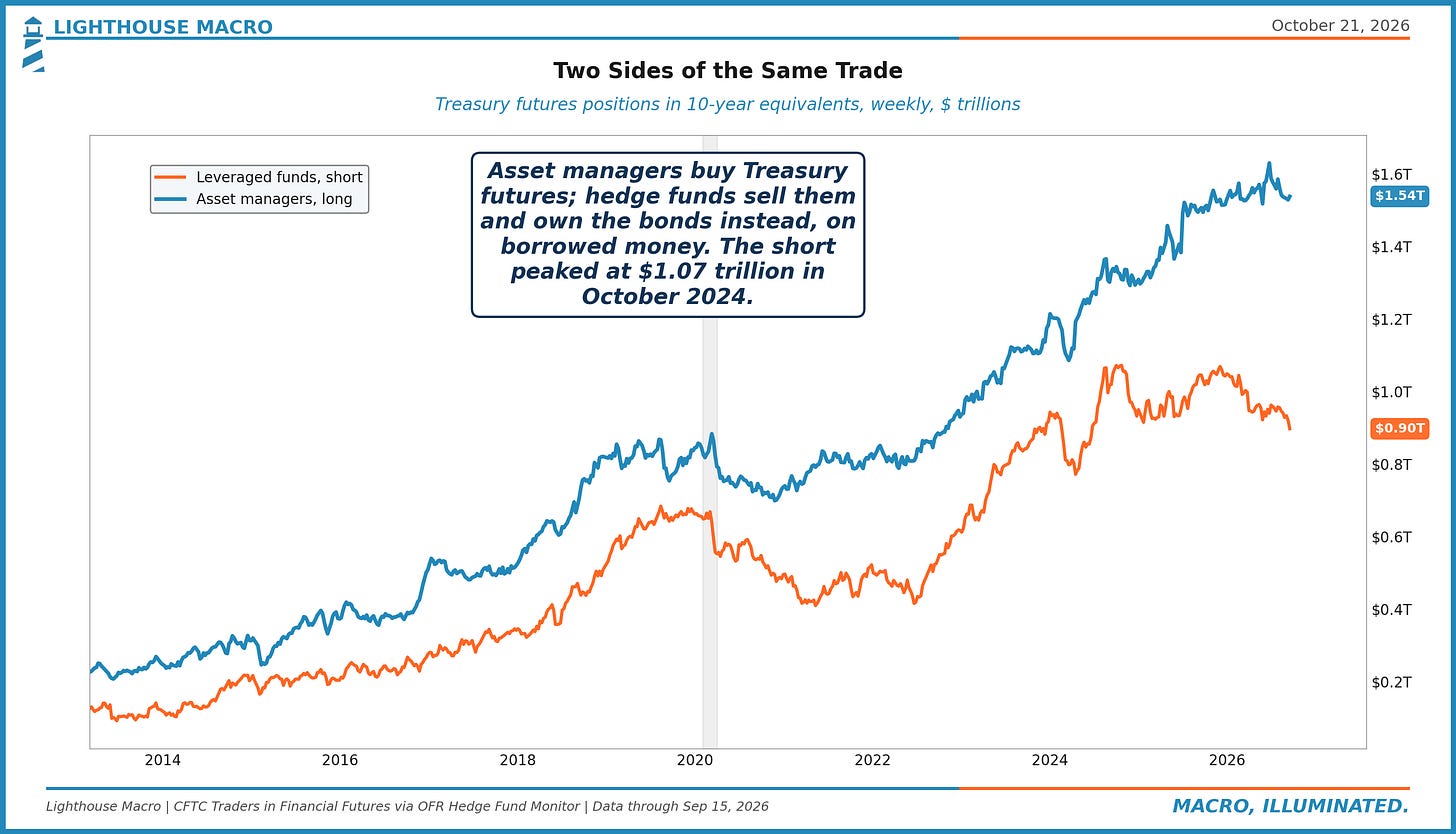
In mid-September, asset managers were long $1.54 trillion of Treasury futures, measured in 10-year equivalents, and leveraged funds were short $897 billion. These two lines move together for a reason.
The other end shows up in the hedge fund filings the SEC gathers on Form PF.
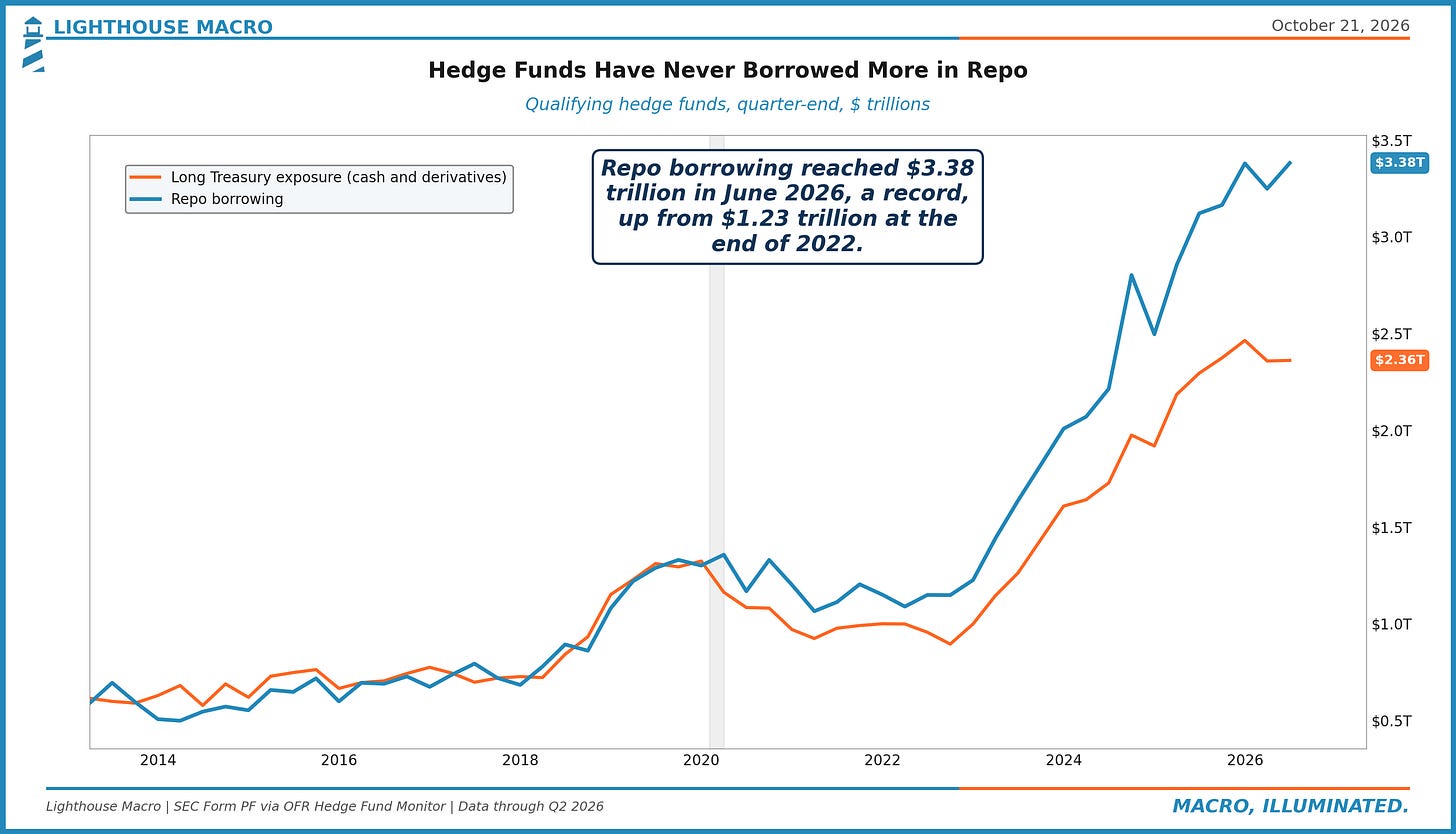
Hedge funds reported $3.38 trillion of repo borrowing at the end of June, the most on record, up from $1.23 trillion at the end of 2022. Their long exposure to Treasuries, cash and derivatives combined, was $2.36 trillion.
Match it all up and it looks like this. Your money fund lends cash to a dealer, the dealer passes it on to a hedge fund, and the hedge fund uses that cash to buy Treasuries and sells futures to an asset manager. Every link in that chain is a nonbank except one, the one in the middle, and that one is usually owned by a bank.
When the Safe Asset Gets Sold
We saw the chain run backwards once already.
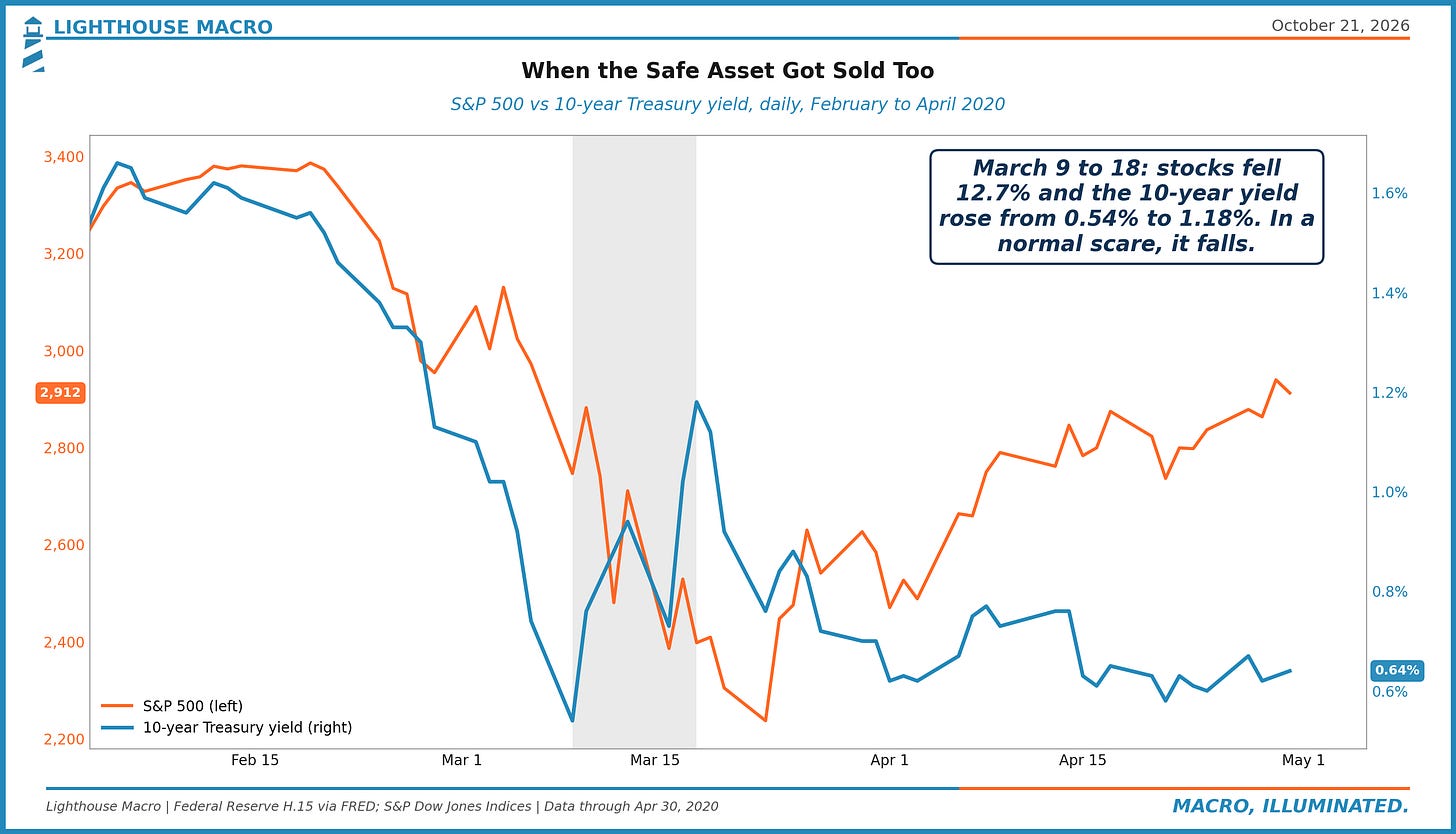
In March 2020, when everyone needed cash at the same time, they sold what they could, and the first thing you can always sell is a Treasury. From March 9 to March 18 the S&P 500 dropped 12.7%, and the 10-year yield, which normally falls during a panic as money seeks refuge, went up from 0.54% to 1.18%. One of the sellers was the basis trade. Leveraged funds cut their net short position in Treasury futures by $107 billion, measured in 10-year equivalents, between mid-February and the end of March, and unwinding a short future means selling the bond paired with it. Dealers couldn't digest all of it, and the Fed intervened, buying $1.27 trillion of Treasuries over the five weeks after March 11.
Remember how little Treasuries mattered in the fire-sale paper? That's the link between the two halves. Treasuries are the simplest asset in the world to sell, right up until everyone's selling them at once with borrowed money. What made the safest market in town a fire sale was the funding, the half the paper set aside.
How to Read It
There are four public measures of all this, and they tick on very different clocks.
Daily, the FICC sponsored repo volumes capture the middle of the chain, cash flowing in from lenders such as money funds and out to borrowers such as hedge funds. Weekly, the CFTC futures data captures the trade itself, and when the leveraged funds' short falls swiftly the trade is coming off, which is precisely what happened in March 2020. Monthly, the OFR money fund data captures who the funds are lending to, and a pullback from dealers is the cash beginning to leave. Quarterly, Form PF captures the borrowing with about a quarter's lag, which is why the latest number is for June.
None of these is a stress signal in and of itself, because all four have mostly gone up for three years. Size gives you the potential scale of the next unwind. Speed tells you when one has started.
What It's Saying Now
Briefly, since this is the part that shifts every month.
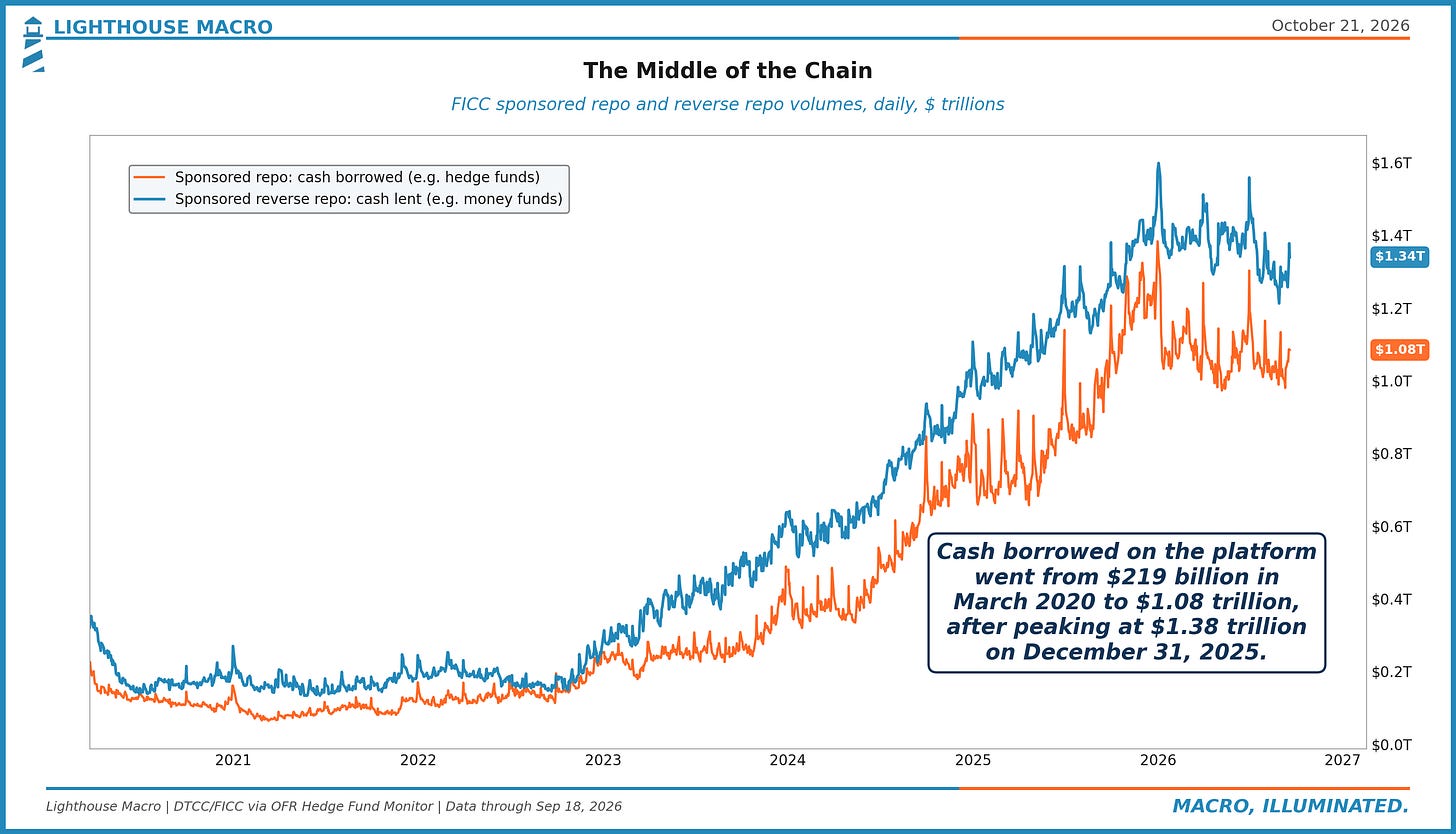
This year the chain has mostly stopped expanding, at about the largest it's ever been. Sponsored repo, the cash dealers pass from lenders like money funds to borrowers like hedge funds, peaked at $1.38 trillion at the end of 2025 and stood at $1.08 trillion in mid-September. The leveraged funds' futures short is below its 2024 peak, and hedge funds' total repo borrowing has flatlined at the top, $3.38 trillion at the end of 2025 and again in June.
Matthew McCormick, Srini Ramaswamy and Hugo De Vere at the Dallas Fed argued last week that the trade has simply become less rewarding for the asset managers on the futures side. Long-term yields have moved toward the 6% the futures contracts use to line up the bonds that can be delivered into them, which makes those bonds look more alike and shrinks the option asset managers were effectively selling by owning the futures. They believe part of the hedge funds' risk has shifted into a cousin of the trade built on interest rate swaps, which packs more risk into every dollar, so the same risk budget needs fewer futures, fewer cash bonds and less repo.
None of that makes the chain small. The BIS, in a bulletin last month from Mathias Drehmann and Sonya Zhu, found that when nonbanks hold a large portion of the Treasury market, the chances of severe dysfunction in the next three months rise, to around 6% when that share is in its top tenth, and that's without counting hedge funds, which their data couldn't include. The IMF's October Global Financial Stability Report puts hedge funds at around 9% of the market in 2025, more than double their share in 2022.
If you run a business, two pieces of this affect you directly. The cash you keep in a money fund is the first link in the chain. And the rate on a good chunk of the borrowing you'll do is priced off Treasury yields, and in March 2020 that borrowing got more expensive in the middle of a panic, when the rule of thumb says it should have gotten cheaper.
Hedge funds borrowed $1.23 trillion in repo at the end of 2022. In June it was $3.38 trillion.
Don't navigate in the dark. Join the Watch.