The Refiner's Cut
Welcome back to Marginal Matters, the free series where we take one piece of research, sit with it, and walk it through our own data until it makes sense.
Don't navigate in the dark. Join the Watch. The Beacon, The Beam, The Horizon and The Chartbook, every Crosscurrents issue, and Pharos, the terminal the research is built on. $500 a year or $50 a month.
This week we're going to the one step between the oil field and the gas pump that hardly anyone thinks about, which, as it turns out, is where most of the action is right now.
The Number on the Sign
CPI came out yesterday, and of everything in that report, the price people feel first is the one on the big sign at the gas station. When that number climbs, the usual suspects get rounded up pretty quickly. Either oil went up, or somebody along the way is gouging, and depending on who you ask that somebody is the station owner, the oil companies or the government. The oil explanation is usually the right one, too. Gasoline and crude tend to move together closely enough that if you know what oil did, you can make a decent guess at what the pump did.
For most of this summer that guess came in low, and by a lot.
Jesse Thompson and Garrett Golding, who cover energy at the Dallas Fed, published a short note on October 8 called "Refinery outages pumping up fuel prices more than cost of crude oil," and the title more or less gives away the argument. Boiled down, it goes like this: the world has lost a big chunk of its ability to turn crude into fuel, the price of that conversion has blown past even its 2022 extremes, and the effect is going to outlast whatever happens to crude itself.
We took each of those to our own data. They hold up, and the part that sticks around after the crude story ends is the one worth your ten minutes.
What a Refinery Actually Does
You can't put crude in a car. Crude is a thick soup of hydrocarbons of every size, and before it's any use to anybody it has to go through a refinery, which is about as close as the real world gets to a giant chemistry set. The crude gets heated until it separates into its pieces, light stuff on top and heavy stuff on the bottom, and then the heavy, low-value pieces get broken into smaller, more valuable molecules. The industry's word for breaking them is cracking. Hold onto that, because it's about to name the whole piece.
Out of one 42-gallon barrel, a US refinery gets roughly 19 to 20 gallons of gasoline and 11 to 12 gallons of distillate, which is mostly diesel and heating oil, per the EIA, with jet fuel and a long tail of other products making up the rest. The refiner's whole business is buying the barrel and selling what comes out of it.
Here's what both ends of that trade have done since 2006, with the fuels converted to dollars per barrel so all three sit on the same scale.
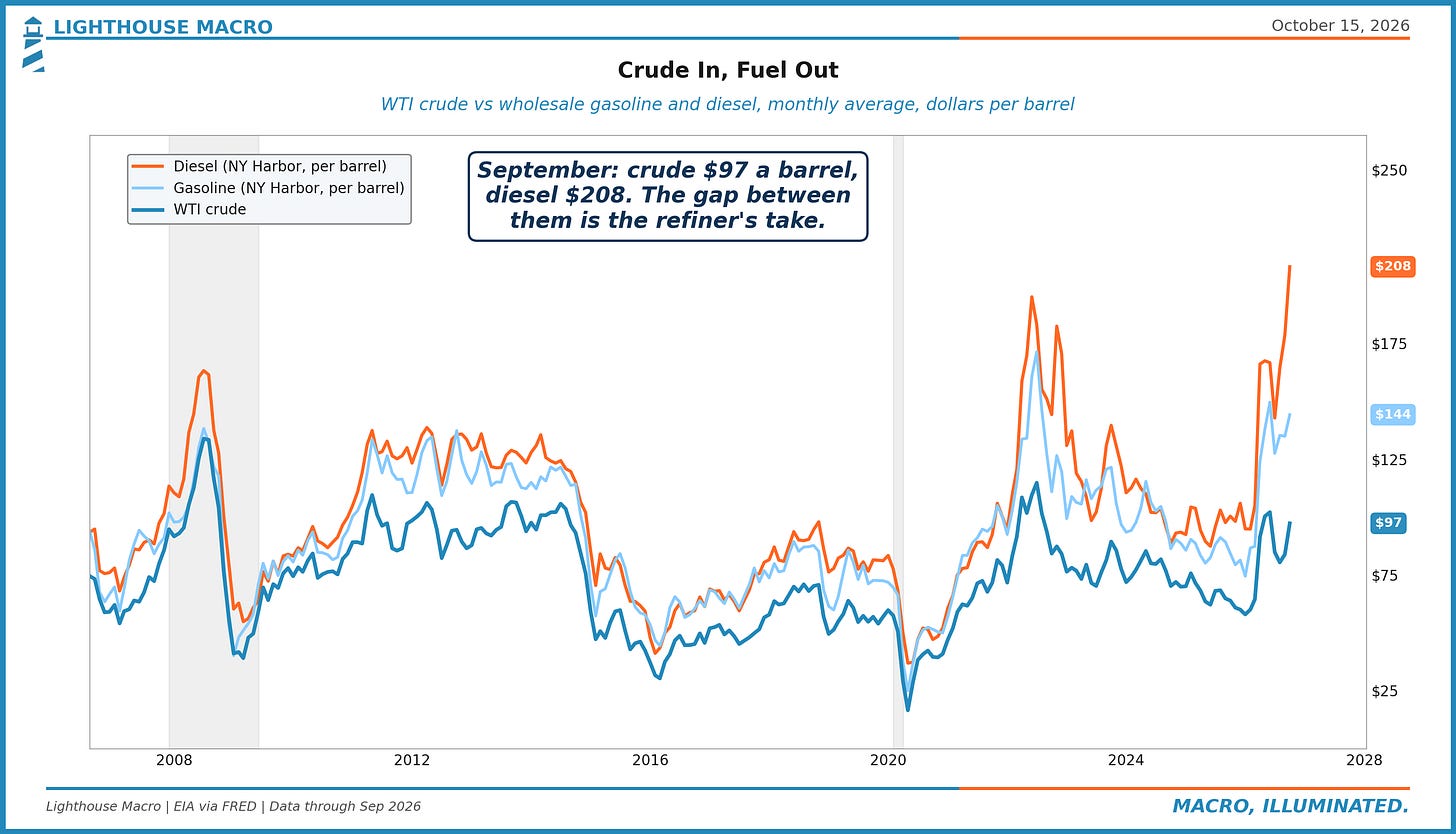
For most of those twenty years the three lines travel as a pack, with the fuels riding a little above the crude they're made from. Then look at the right edge. In September, a barrel of WTI averaged $97, and the diesel that same barrel could be turned into sold wholesale for $208.
The Spread With the Funny Name
The gap between those lines has a name, and it comes straight from the chemistry: the crack spread. It's what's left over for the refiner after paying for the crude, before running costs.
The standard way to quote it is called the 3-2-1, and it's a lot less intimidating than it sounds. Take three barrels of crude, turn them into two barrels of gasoline and one of diesel (which is close to what a typical US refinery actually makes), and divide what's left over by three. No single refinery earns exactly that number, but it's the cleanest way to watch the whole industry's take at once.
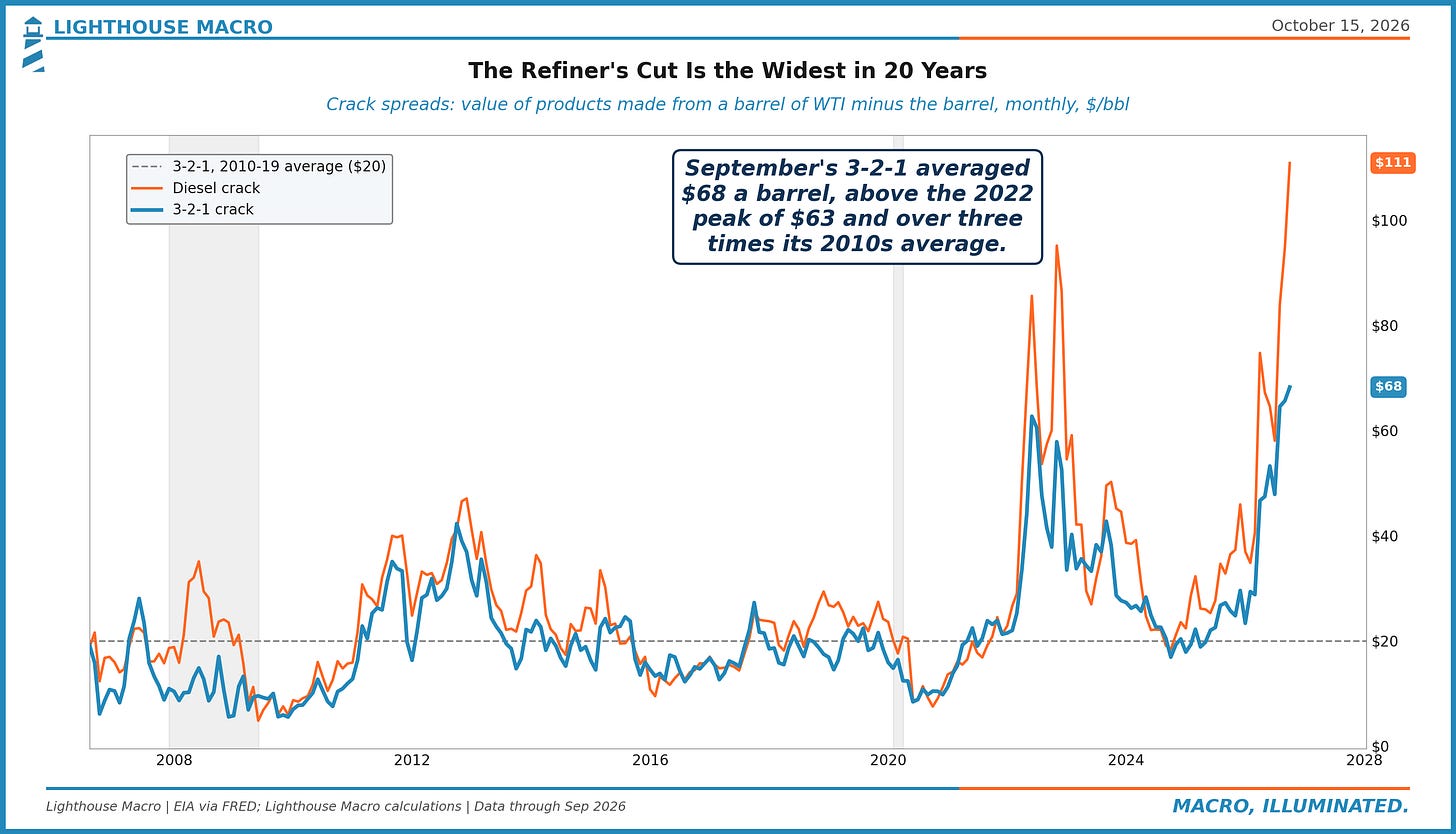
For most of the 2010s it hung around $20 a barrel, and refining was a fairly boring business. Then Russia invaded Ukraine, the global fuel market got thrown into a blender, and in 2022 the 3-2-1 shot up to $63, which at the time looked like the kind of number you see once in a career and then tell stories about. This September it averaged $68, the highest in the twenty years of data we have for it. Diesel on its own is wider still.
The Dallas Fed's first chart shows the same thing, crack spreads past their 2022 highs, and the authors are direct about whose fault it isn't. The pricing, they write, reflects "acute, multifaceted supply constraints in the global market for refined fuels rather than retailer or distributor markup." So before anybody goes after the guy behind the counter, it's worth looking at the refineries, and specifically the ones that aren't running.
How the World Lost a Tenth of Its Refineries
The easiest way to think about this is bread. Crude is the wheat and refineries are the bakeries. If half the bakeries in town burned down, bread would get expensive even with every silo full of wheat, and whichever bakeries were still standing would make a killing on every loaf. That's roughly where the global fuel market is in 2026, and the note walks through how it got here in two stages, one slow and one very fast.
The slow part had been building for years. Fuel demand kept growing, but more gently than it used to, with slower population growth, more efficient cars and more electric ones, and so the industry wasn't in much of a hurry to build refineries. Between 2019 and 2025 the world's fuel use grew by about 4 million barrels a day while refining capacity grew by 2.3 million. Where the capacity sat shifted too. New, enormous complexes went up in China and the Middle East, while older refineries in Europe and North America closed down, squeezed by thin margins, regulation and age. In the US about half of that was offset by plants converted to make renewable diesel out of things like soybeans (one of those facts we didn't know we needed until we read it) and by new Gulf Coast units built to handle light shale oil. In Europe, record natural gas prices finished off a lot of the older plants that were already on their way out.
Then came the fast part. Ukraine's drones, heavier and more accurate than they used to be, knocked out as much as 60% of Russia's refining capacity over the summer, and Russia held back fuel exports to keep its own market supplied. The Strait of Hormuz closed in March, and strikes plus the blocked tanker traffic have cut what Middle East refineries process ever since. China slashed its crude imports, ran its own refineries less and held back its fuel exports to stretch what it had.
Add up all those burned-down bakeries and the authors put the loss at 6 to 8 million barrels a day of refining since late spring, which is up to a tenth of all the refining in the world, gone more or less at once.
Why Diesel Takes the Hit
That loss doesn't land evenly. Russia and the Gulf are big exporters of diesel in particular, Europe imports a lot of it, and Europe has been leaning on US cargoes to fill the hole (with the Rhine running low enough to tie up barge traffic, just to keep things interesting). So the squeeze shows up at the pump in one very specific place.
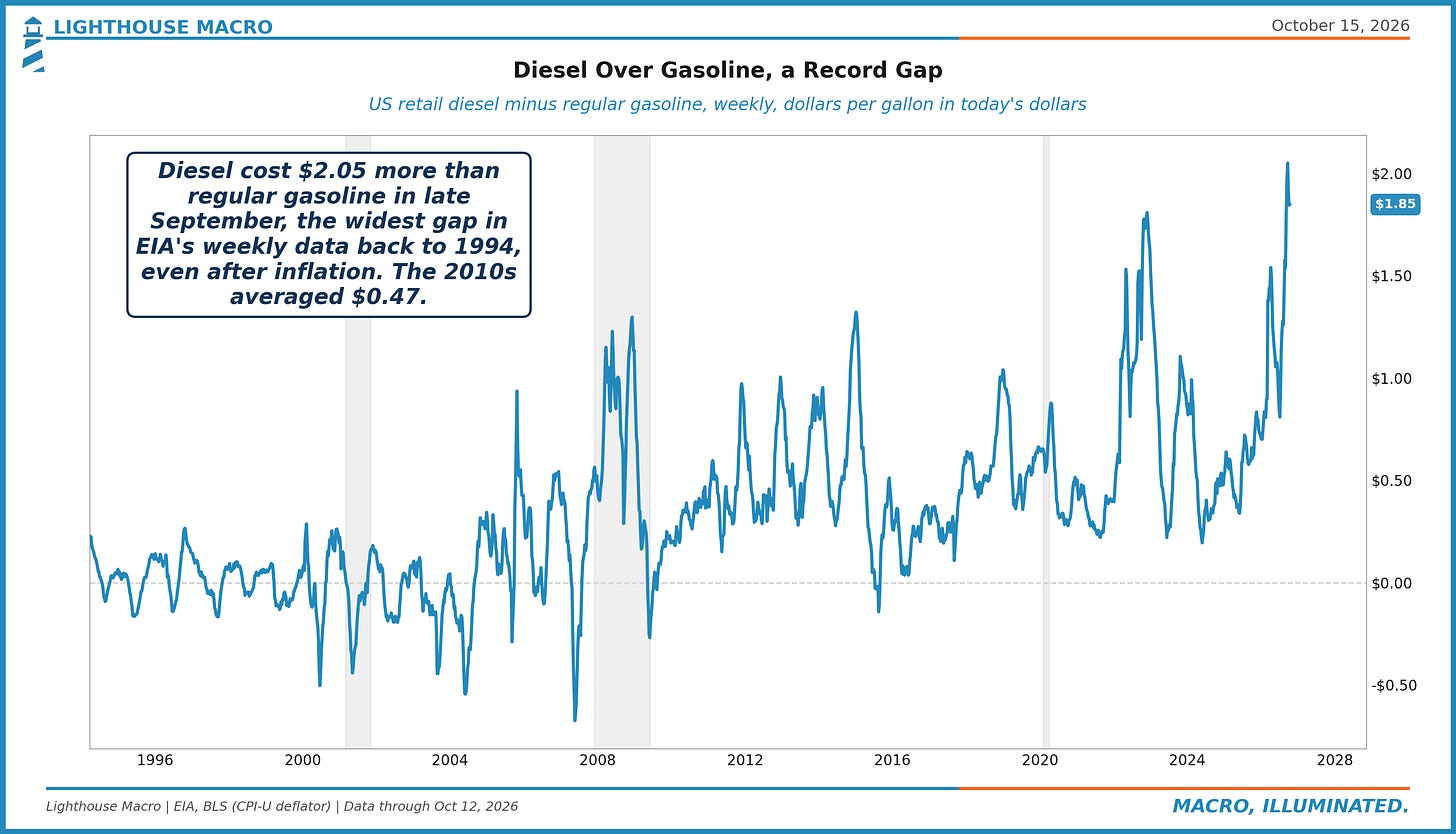
Diesel usually costs a bit more than regular gasoline, something like fifty cents a gallon through most of the 2010s. In the week of September 21 the gap hit $2.05, the widest in EIA's weekly data going back to 1994, even after adjusting for inflation. The note makes the same point about its own version of this chart: people have paid this much for fuel before, in real terms, but diesel has never run this far over gasoline.
And diesel punches above its weight. Gasoline gets you to work. Diesel gets the groceries to the store, the grain to the port and the packages to your porch, so a diesel shock has a way of turning up in the prices of things that have nothing to do with fuel, a few months later and a little at a time.
The Shock Absorbers
When a market loses supply, inventories are what carry everybody while things adjust. The note spends a good while here, and this is where it gets most interesting.
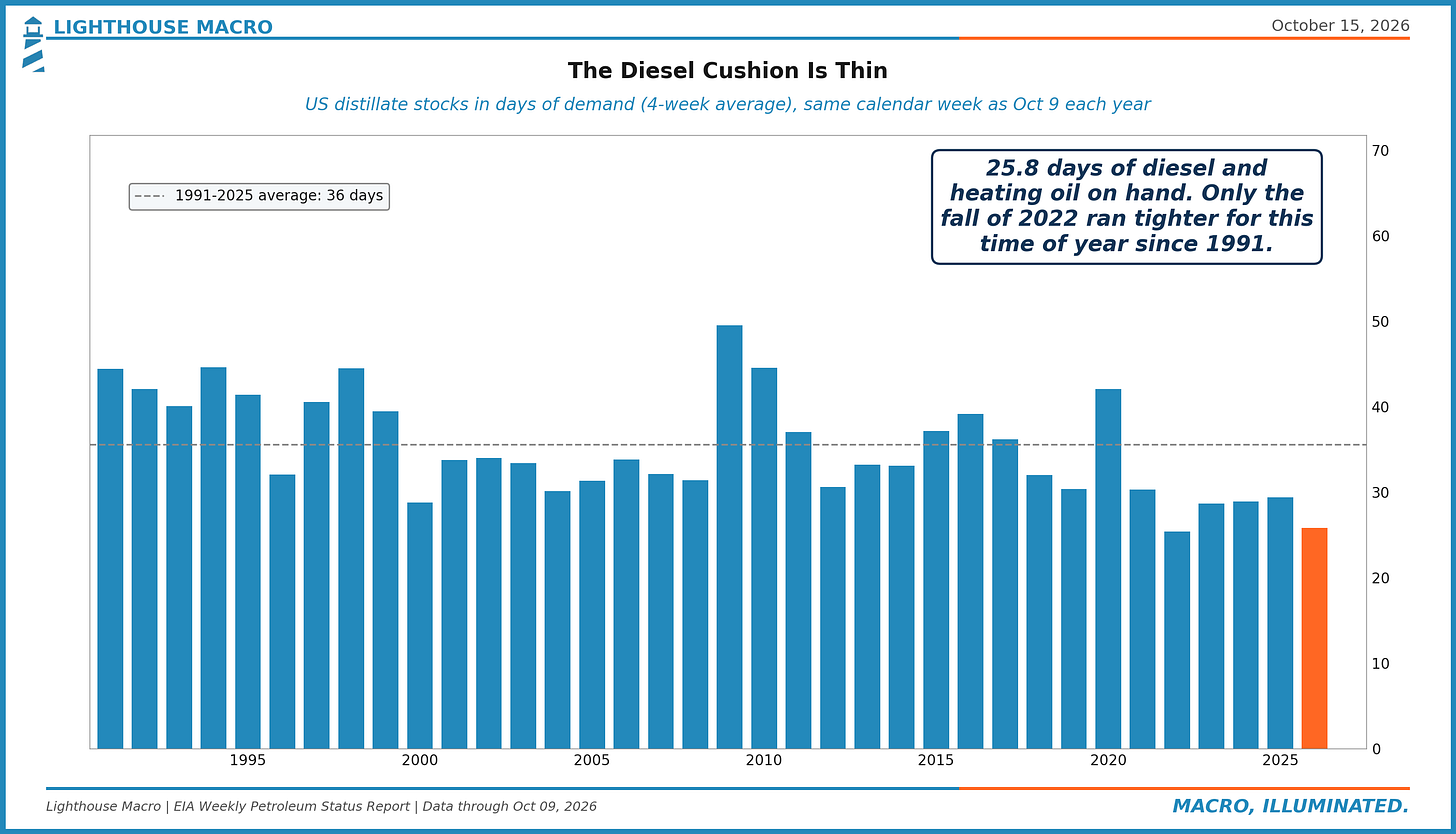
We like counting stocks in days rather than barrels, because a pile of barrels doesn't know how fast it's being used. Measured that way, the US has about 26 days of diesel and heating oil on hand, against an average of 36 for this time of year since 1991, and only the fall of 2022 ran tighter. The emergency crude stockpile, the Strategic Petroleum Reserve, is the smallest it's been since 1982 after this year's releases, and the authors note that depending on how low you think it can safely go, there may be only months of drawing left in it.
Two lines in the note are worth the price of admission (still zero). The first is the reminder that the world isn't actually running out of oil. Globally, the authors estimate something like 8 billion barrels sitting in tanks and on ships, which sounds like years of cushion. The second line is the catch, and it's a great one: "Everything is not available everywhere all at once." A tank full of the wrong product in the wrong port doesn't help a trucker in Ohio, so local shortages and price spikes show up long before the global total looks scary. It's a little like having plenty of money in a retirement account and not enough in checking.
How to Read It
There are really three prices hiding inside the number on the sign, and once you split them apart the headlines get a lot easier to read.
Crude is the one you see on the news, and it tells you the oil story: OPEC, the Strait, the dollar. The crack spread tells you the refining story, whether there's enough capacity in the right places to turn that crude into fuel, and you can watch it every day from futures prices for gasoline and diesel against crude. Whatever's left between the wholesale price and the pump is the station and the distributor, and that's the piece the Dallas Fed says isn't the problem right now.
When the crack is narrow, the pump follows crude and the old rule of thumb works fine. When it's wide, like now, fuel can stay expensive even if oil eases, and anyone judging the pump by the price of oil is going to keep being surprised.
For the cushion, the EIA's weekly petroleum report comes out Wednesday mornings with stocks of crude, gasoline, diesel and jet. Divide the stocks by what's being used and you've got days of supply, which is the version worth watching.
What It's Saying Now
Briefly, since this is the part that changes every month.
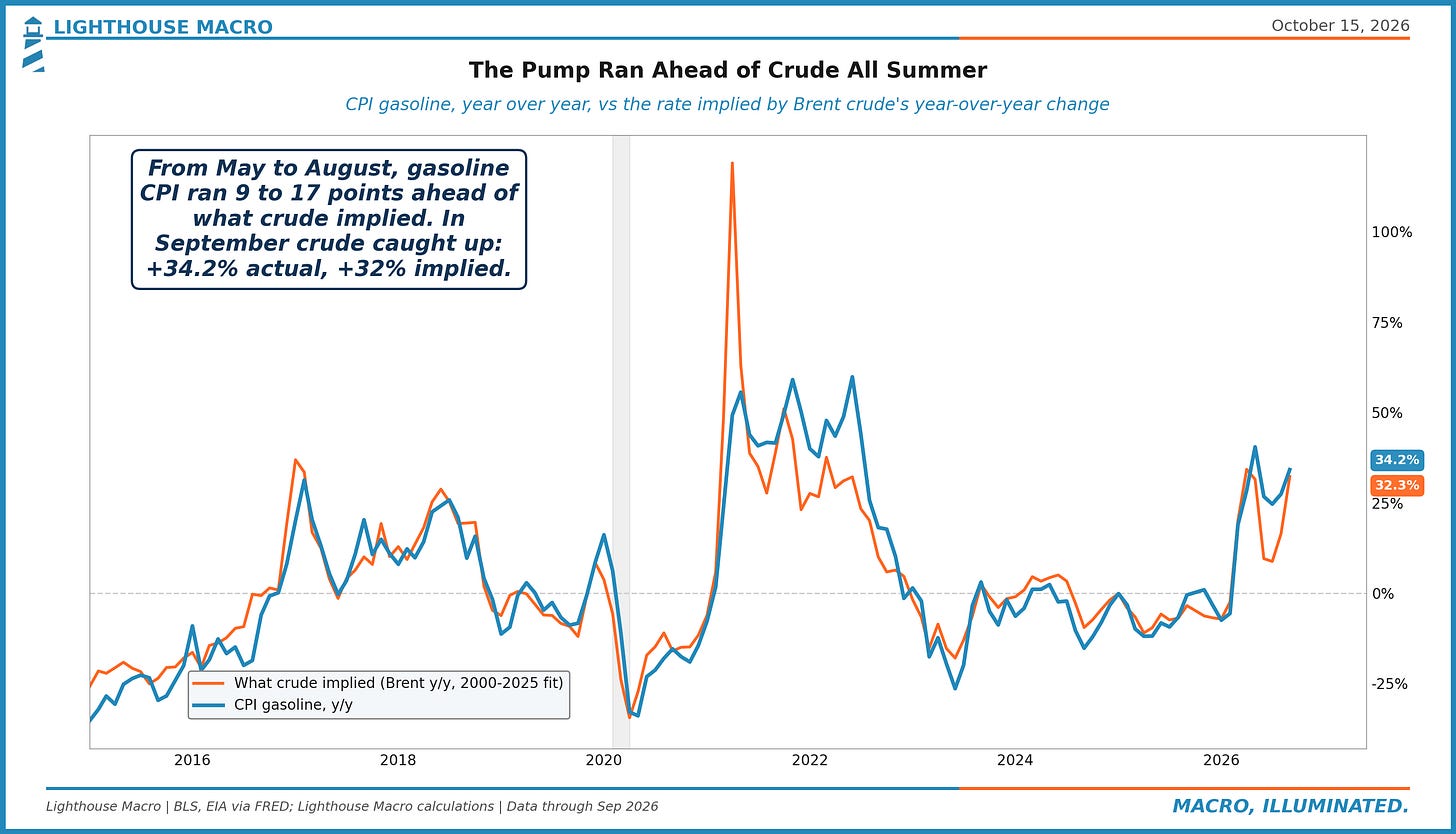
In September, gasoline in the CPI jumped 9.1% in a single month and is now up 34.2% from a year earlier. Going by how gasoline has tracked Brent since 2000, that number ran well ahead of what crude alone would have suggested all summer, by anywhere from 9 to 17 percentage points every month from May through August, and that gap was the refining squeeze showing up in the inflation numbers. In September it mostly closed, with the pump still climbing. Brent finally caught up, averaging $114 a barrel against $91 in August, and crude on its own now points to about 32%.
So the squeeze hit the inflation numbers first, over the summer, and the crude spike is landing on top of it now. The crack didn't give anything back when oil jumped, either. September's $68 was the record. If crude eases from here while the refineries stay broken, the summer pattern is the one to expect back, and that's the authors' warning: headline inflation "could remain above where oil price trends would normally indicate for as long as a significant portion of global refining capacity stays offline." Because damaged refineries take months to fix, they expect the crack to stay wide even after crude flows through Hormuz normally again.
If you run a business that moves things, that's the bit to take with you. Your fuel bill is following the refiners' margin as much as the oil price, so a diesel surcharge can keep climbing on a day crude falls, and a hedge on crude only covers part of the bill.
Through the 2010s, the refiner's cut averaged about $20 a barrel. In September it was $68.
Don't navigate in the dark. Join the Watch.
Bob Sheehan, CFA, CMT
Founder & Chief Investment Officer, Lighthouse Macro
[Lighthouse Macro](https://lighthousemacro.com) | Research | Pharos | @LHMacro