The Belly Is Rumbling
The Setup
On Tuesday we wrote that Wednesday’s flash PMI was Goolsbee’s fork, and a composite under 54 would hand the barrel back its supply-shock label. It printed 58.4. S&P Global’s composite rose from 56.0 in August to its fastest expansion since July 2021, services at 58.7 against a 56.0 consensus and manufacturing at 57.0 against 53.6, with backlogs growing at the fastest rate since May 2022. The curve moved within the hour. The 10-yea r closed at 5.11% on Treasury’s par curve, its first close above 5.10% since July 2007; the 5-year closed at 4.99%, the same vintage; the 2-year added 14 basis points to 4.85%. Then at 1:00pm Treasury sold $70 billion of 5-year notes, and the belly got priced.
Don’t navigate in the dark. Join the Watch.
Research Only, $495/yr: every Beam, Beacon, Horizon and Chartbook.
Complete, $750/yr: all of it plus Pharos, the terminal the research is built on.
The Data
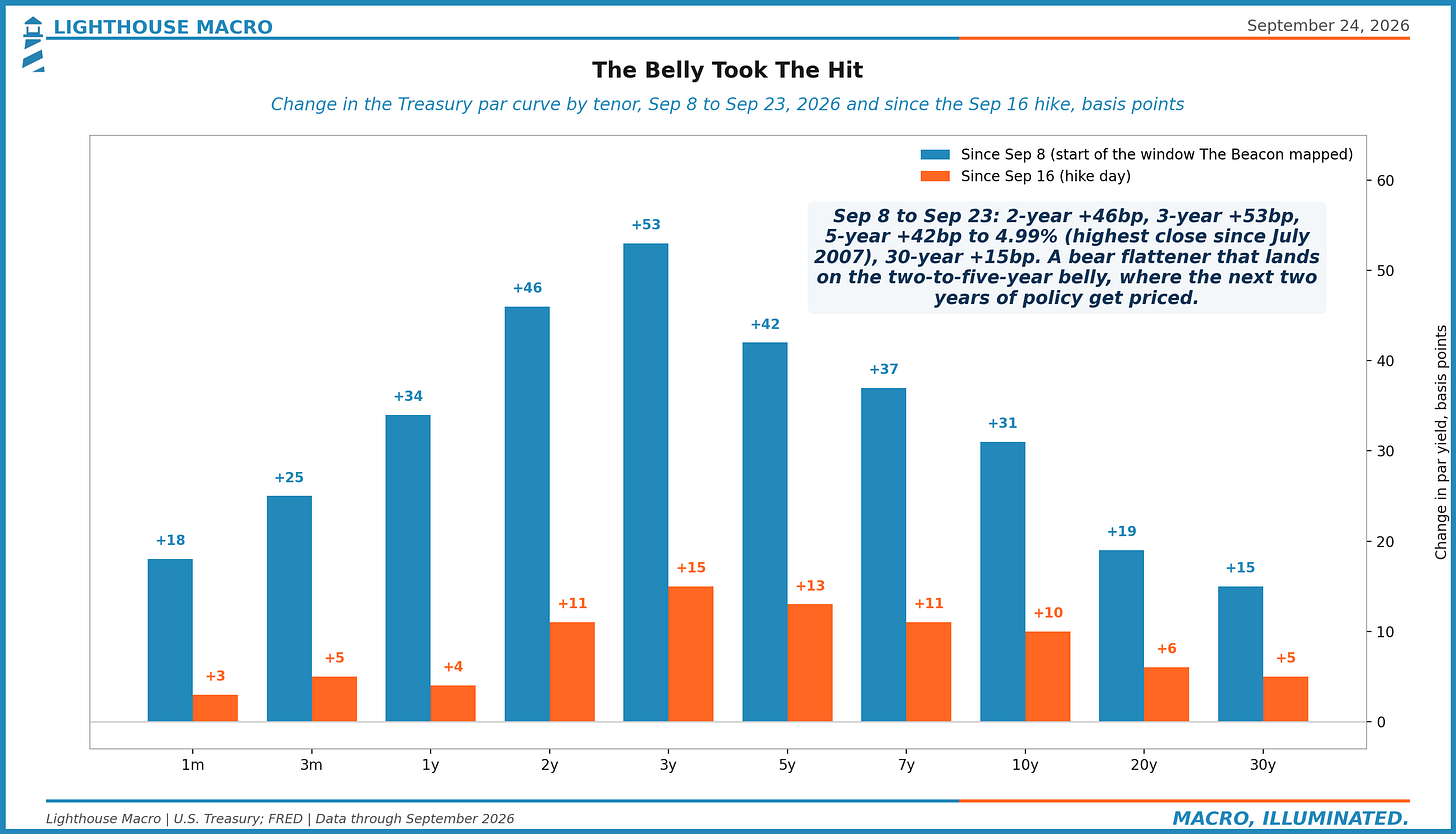
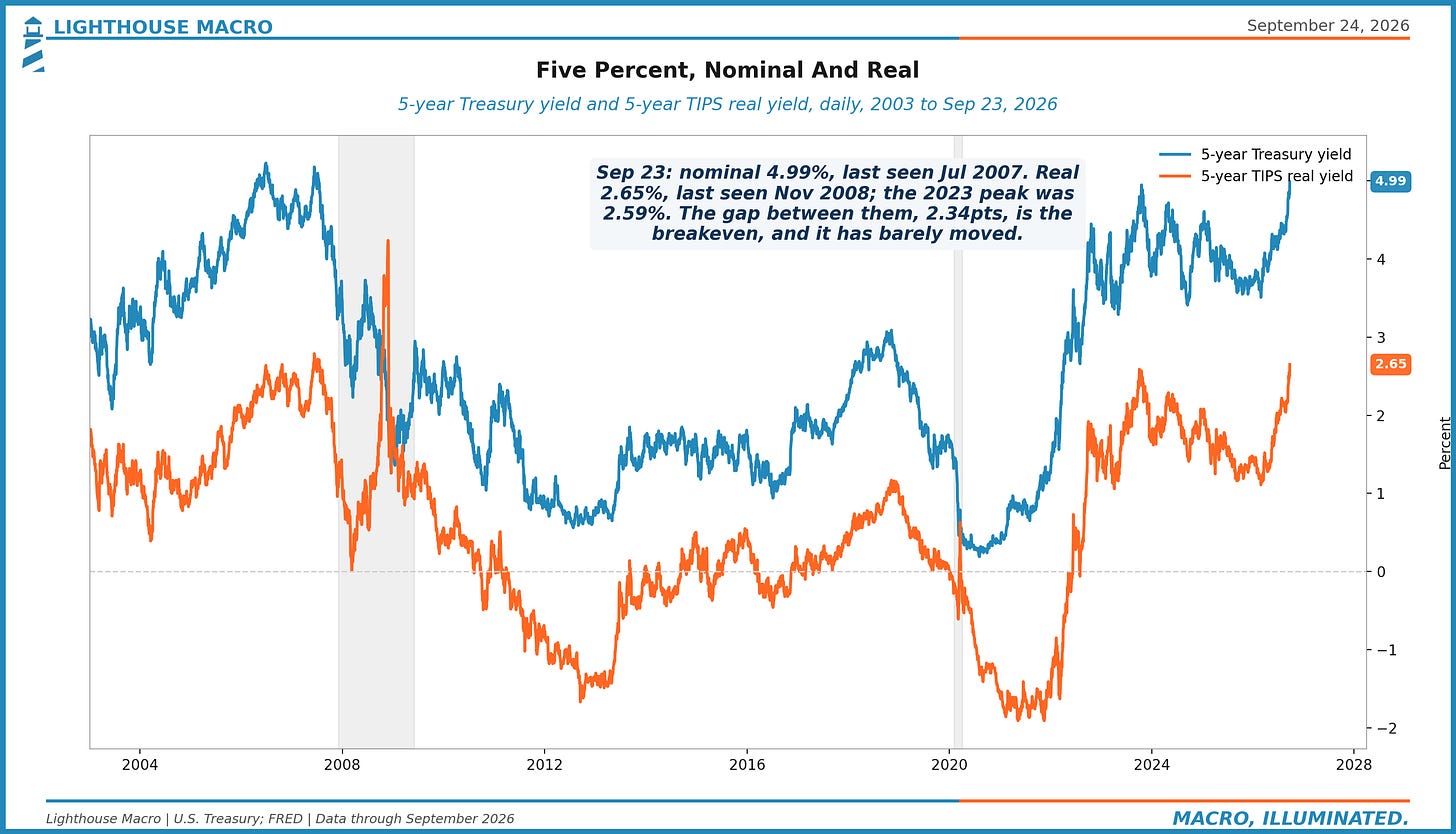
From September 8, the start of the window The Beacon mapped, to Wednesday’s close, the 2-year is up 46 basis points, the 3-year 53, the 5-year 42, the 10-year 31 and the 30-year 15. Thirteen of the 5-year’s 42 came after the hike. The 5-year real yield closed at 2.65%, a level last seen in November 2008 and above the October 2023 peak of 2.59%, while the 5-year breakeven sat at 2.34%, one basis point from hike day. That is the real cost of money, landing in the tenor where the next two years of policy sit.
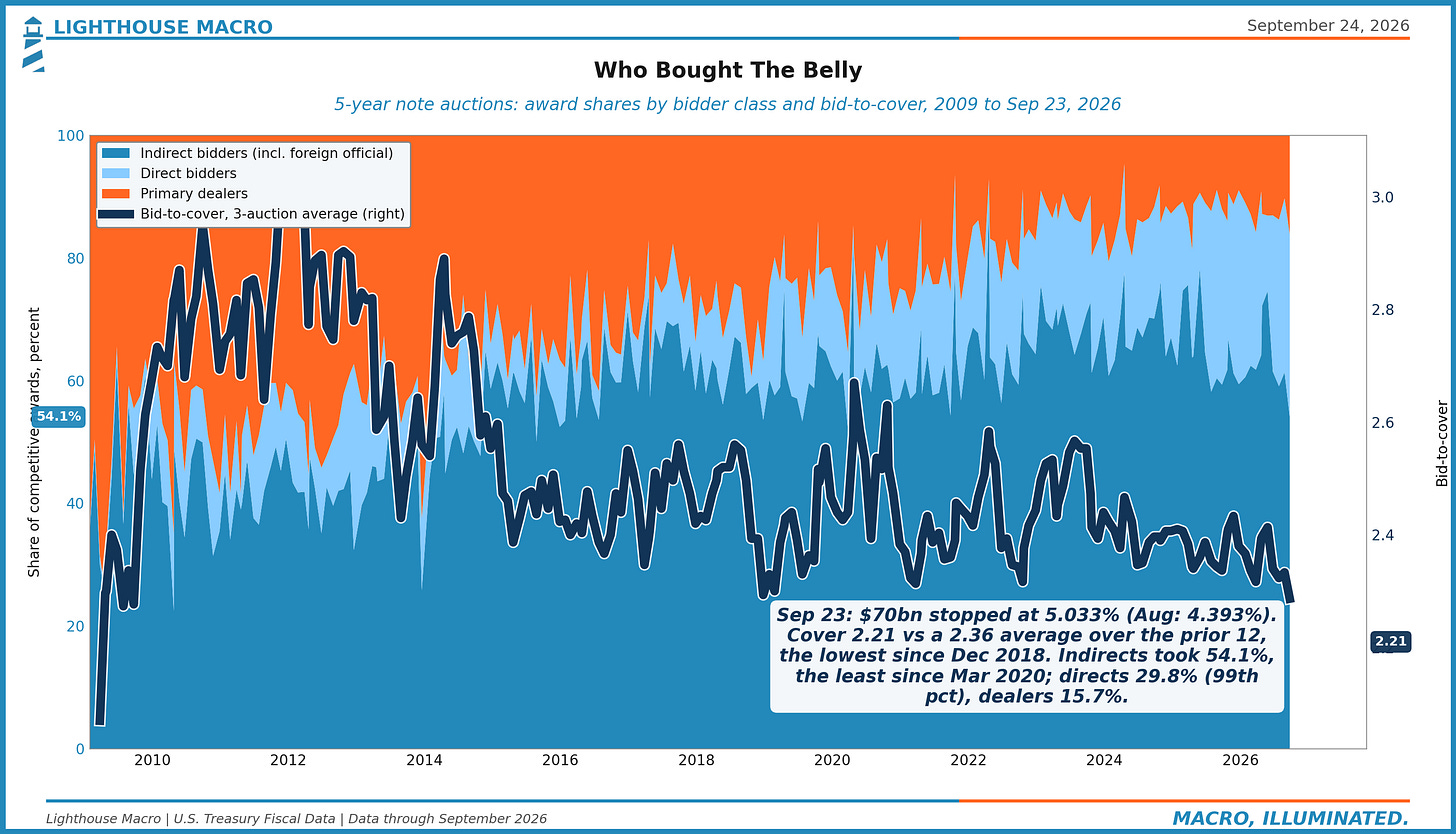
The auction was the flow. The 5-year stopped at 5.033%, 64 basis points above August and the highest stop for the tenor since June 2006, about three basis points through the 1:00pm when-issued. Cover was 2.21 against a 2.36 average over the prior twelve, the lowest since December 2018. Indirects, the class that includes foreign official accounts, took 54.1%, their smallest share since March 2020; directs took 29.8%, the 99th percentile since 2009. The foreign bid stepped back, and the domestic bid stepped in at a price.
The Mechanism
The belly is where the market writes down the funds rate over the next two to five years, so it moves when the reaction function moves; this week the committee told it what to price. Governor Barr on Wednesday: “In my base case, further policy adjustments are likely to be needed to ensure inflation comes down to target in a timely fashion.” Williams on Thursday morning: another hike by year-end is “reasonable,” and the time for explicit forward guidance is “over.” October on CME’s FedWatch went from the mid-50s after Monday’s close to roughly two-thirds by Wednesday evening.
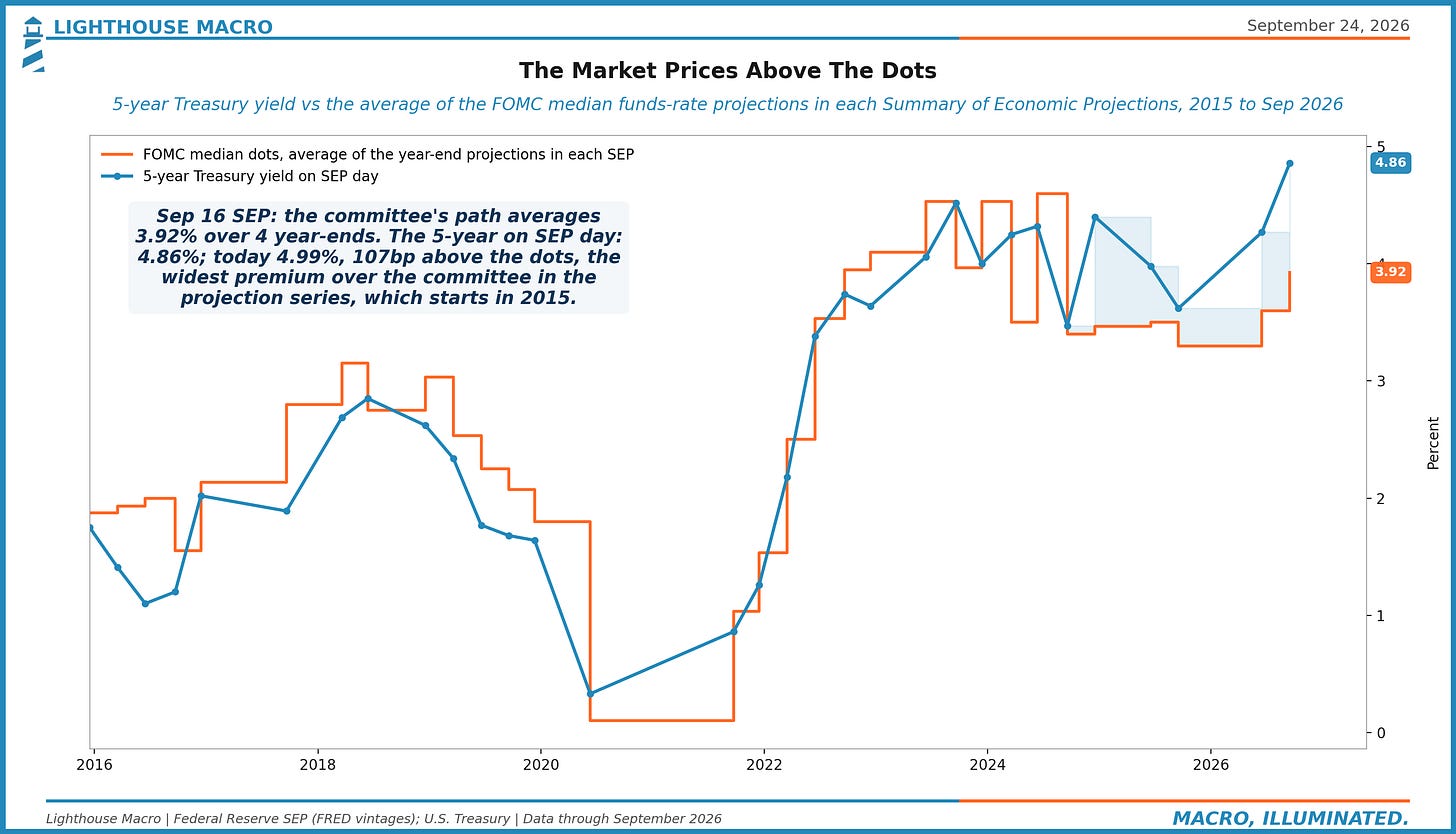
With guidance retired, the market has to price the path itself, and it is pricing it above the committee. The September dots average 3.92% across their four year-ends, 4.1% for 2026 and 2027 and lower after. The 5-year closed hike day at 4.86%, 94 basis points above that average and the widest gap in the projection series; at 4.99% it sits 107 above. Against the longer-run dot less the 2% target, the real 5-year is 145 basis points over neutral, the 95th percentile since 2012. Two readings fit the number: the market expects more hikes than the dots draw, or it is charging a premium for a committee that has stopped speaking. To a borrower they are the same thing.
What Consensus Is Missing
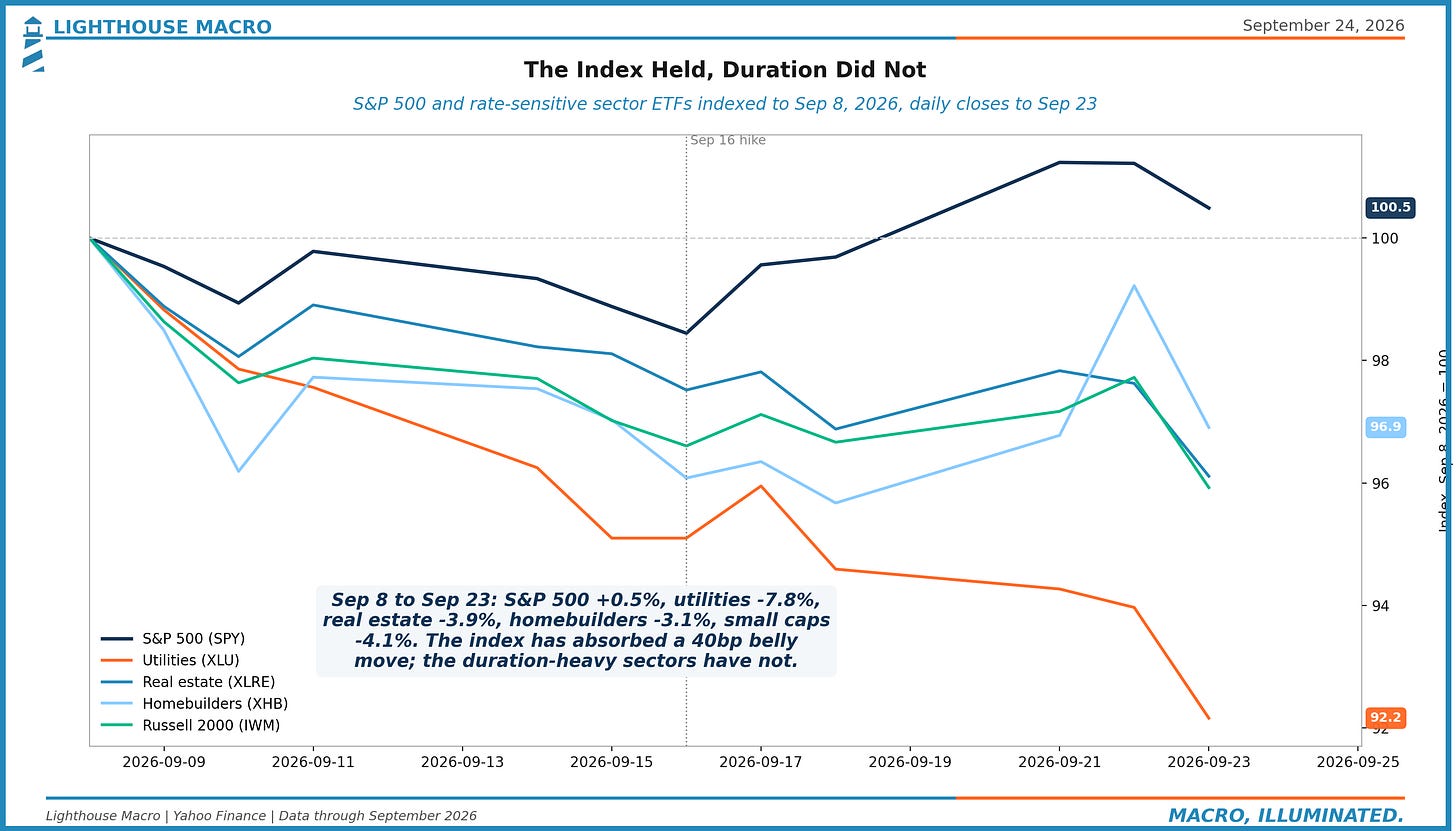
The consensus read is that good news is bad news, the belly sells off on growth and the index shrugs: the S&P 500 is up 0.5% since September 8 even after Wednesday’s 0.8% drop. The transmission is already visible one sector at a time. Utilities are down 7.8% over the same window, real estate 3.9%, homebuilders 3.1%, the Russell 2000 4.1%; the index is held up by the sectors that do not carry duration while the ones that do price the belly. The lazy read is to call the auction a foreign strike. Indirects fell, but directs took a record share; the bid moved home and got paid to. One number cuts against us. PMI selling prices rose less than they did from March to July and the 5-year breakeven has not moved since the hike, so the market is paying for the real rate, not for inflation. If the survey’s growth is the last leg of the tariff pre-buy, and backlogs also lengthen when supply chains stall, the belly has overshot, and Friday’s durable goods report would start to say so.
What Would Change Our Mind
The first test came Thursday at 1:00pm, and it did not clear. We wanted cover above 2.5 with indirects back above 60% before calling Wednesday positioning into a data day; the $44 billion 7-year stopped at 5.085%, the highest for the tenor since it returned in 2009, on a 2.42 cover, with indirects at 56.5% and directs at 29.9%. Two auctions, the same buyer. Claims: the 4-week average of initial claims was 203,250 in the September 12 week; a reading above 230,000 by the October 8 release would say the survey’s hiring was noise and the belly is pricing a labor market that is not there. Friday’s durable goods report: a fall in core capital goods orders alongside flat unfilled orders would take the backlog story off the table. And the odds: October under 50% by the October 2 payrolls close would say the front end read Barr and Williams too literally.
The So-What
For operators, the 5-year is what the equipment loan, the ARM reset and the five-year term note price off, and it rose 42 basis points in eleven sessions, the 98th percentile of such stretches since 1990. The committee has stopped giving guidance; the belly is the guidance now. Price the next draw off 5%, not off the dots.
For allocators, the read is where Tuesday left it, with the belly added to the list. The 7-year did not clear cleanly, so until claims say the survey hiring is real, 5% on the 5-year is a level, not a bid. The equity leg is the part consensus has not priced: utilities, real estate and builders have already paid for the belly and the index has not, and with stocks and bonds falling together a 60/40 book is one position, not two. The first answer came Thursday at 1:00pm, and the domestic bid showed up twice.