Same Pie, Bigger Slice
Welcome back to Marginal Matters, the free series where we take one piece of research, sit with it, and walk it through our own data until it makes sense.
This week we're following one expensive server from a factory abroad into a data center here, and then, as it turns out, over to the one corner of the economy that never went near it.
The Boxes and the Balance
Picture the loading docks behind the data centers going up around the country, stacked with pallets of servers, racks of chips, networking gear and cooling units, a lot of it made in Taiwan and Mexico. Ask most people what all that does to the trade deficit and they'll land on the obvious answer. We're buying far more from the rest of the world without selling it much more in return, so the gap should be getting a lot wider.
Half of that holds up. By one recent count, AI-related products reached 23% of US imports in 2025, up from 15% in 2023. Where it gets strange is the other half, because while the trade gap did widen some, the broadest measure of what the country borrows from abroad, the current account, is about where it was when the buildout started in earnest. The boxes showed up. The deficit barely noticed.
Julian di Giovanni, an economic research advisor at the New York Fed, published a short post on Liberty Street Economics on October 14 called "Has the AI Boom Impacted the U.S. Current Account?" and his answer, boiled down, is not yet. The current account is the gap between what the country saves and what it invests, and the AI boom hasn't moved either side much: investment shifted toward computing gear as other investment faded, and the firms doing the buying kept saving. The deficit is wider than before the pandemic, and he pins that on a part of the economy that had nothing to do with the servers.
We took it to our own data, and nearly all of it lands. The one piece that doesn't, oddly enough, makes his case stronger.
Here's the puzzle in our numbers.
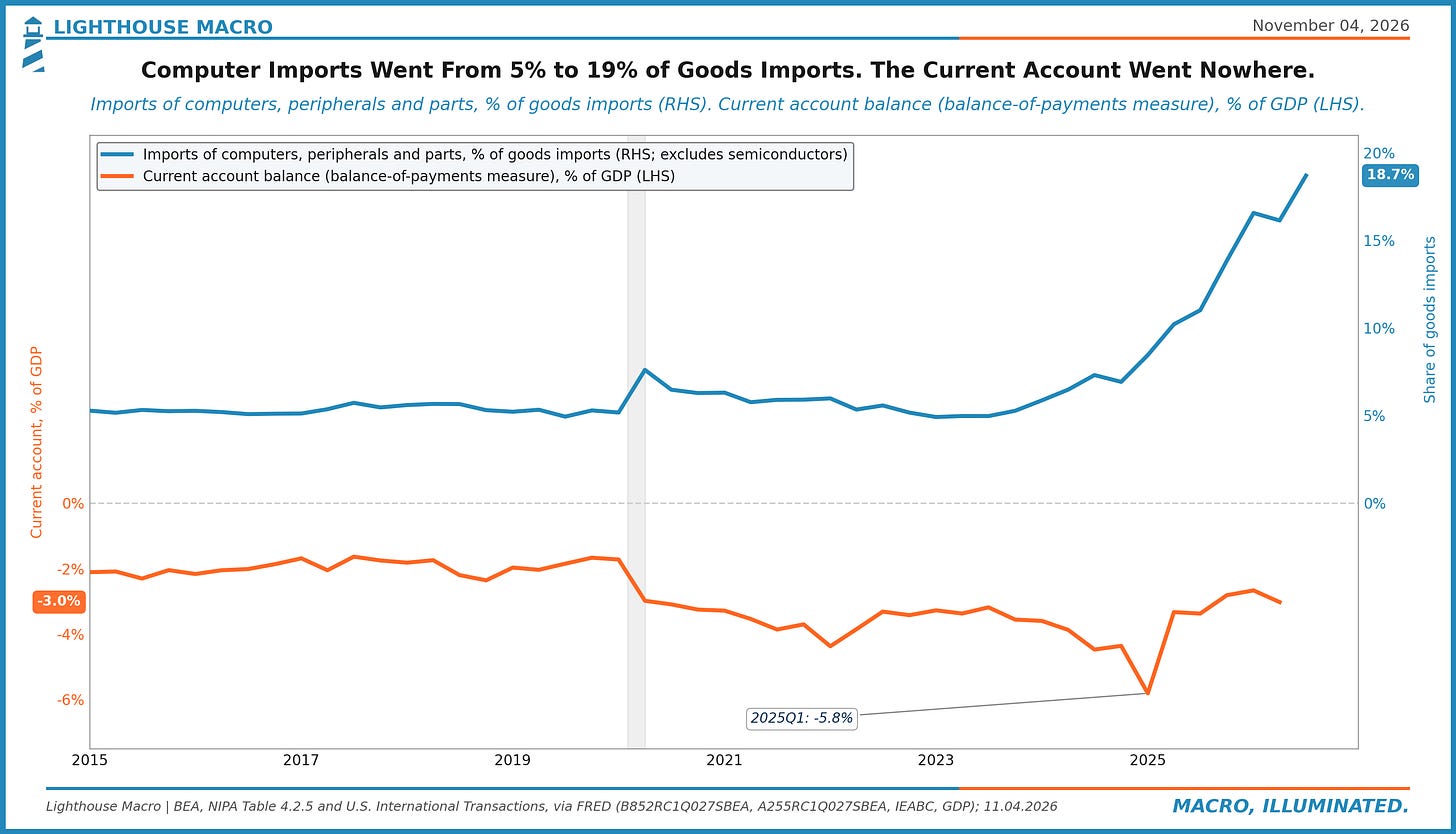
The Bureau of Economic Analysis line for imported computers, peripherals and parts went from 4.9% of goods imports at the start of 2023 to 18.7% in the third quarter, while the current account deficit ended the stretch about where it started. The line leaves out chips and includes every laptop, so it shows the shape of the surge more than its size.
Don’t navigate in the dark. Join the Watch.
All of our written work plus Pharos, the terminal the research is built on.
Or start with the Morning Monitor: the morning note, the full chart deck and the twelve Diagnostic Dozen boards in Pharos.
Two mornings are open so you can see exactly what it is before you pay: Oct 23 and Oct 27.
The first ten annual sign-ups take 25% off the first year with the code FIRSTTEN at checkout.
What the Deficit Actually Counts
Start with which deficit we mean. The current account is the trade balance plus the income crossing borders, mostly interest and dividends, and transfers like money sent home, and it measures what the country borrows from abroad.
Now come at the same number from the other side of the ledger. A household can only spend more than it earns by borrowing the difference, and a country works the same way, except that for a country, spending more than it earns means investing more than it saves. Investment is new stuff built to produce things later, servers included, and saving is whatever households, businesses and government earn and don't spend on day-to-day needs. When the country invests more than it saves, foreigners supply the difference, and their saving arrives as goods and services we buy without selling an equal amount back. Same deficit, counted from opposite ends, give or take a measurement gap we'll come back to.
One bit of jargon. Government sits on the saving side, and its saving goes negative whenever tax receipts fall short of what it spends outside of investment, a close cousin of the budget deficit, though not the same number. Think of one roommate running up a credit card: the apartment as a whole saves less unless everyone else tightens up to cover it, which is how a country full of thrifty households can still save very little as a country.
You can watch that identity hold in our data, back to 1995.
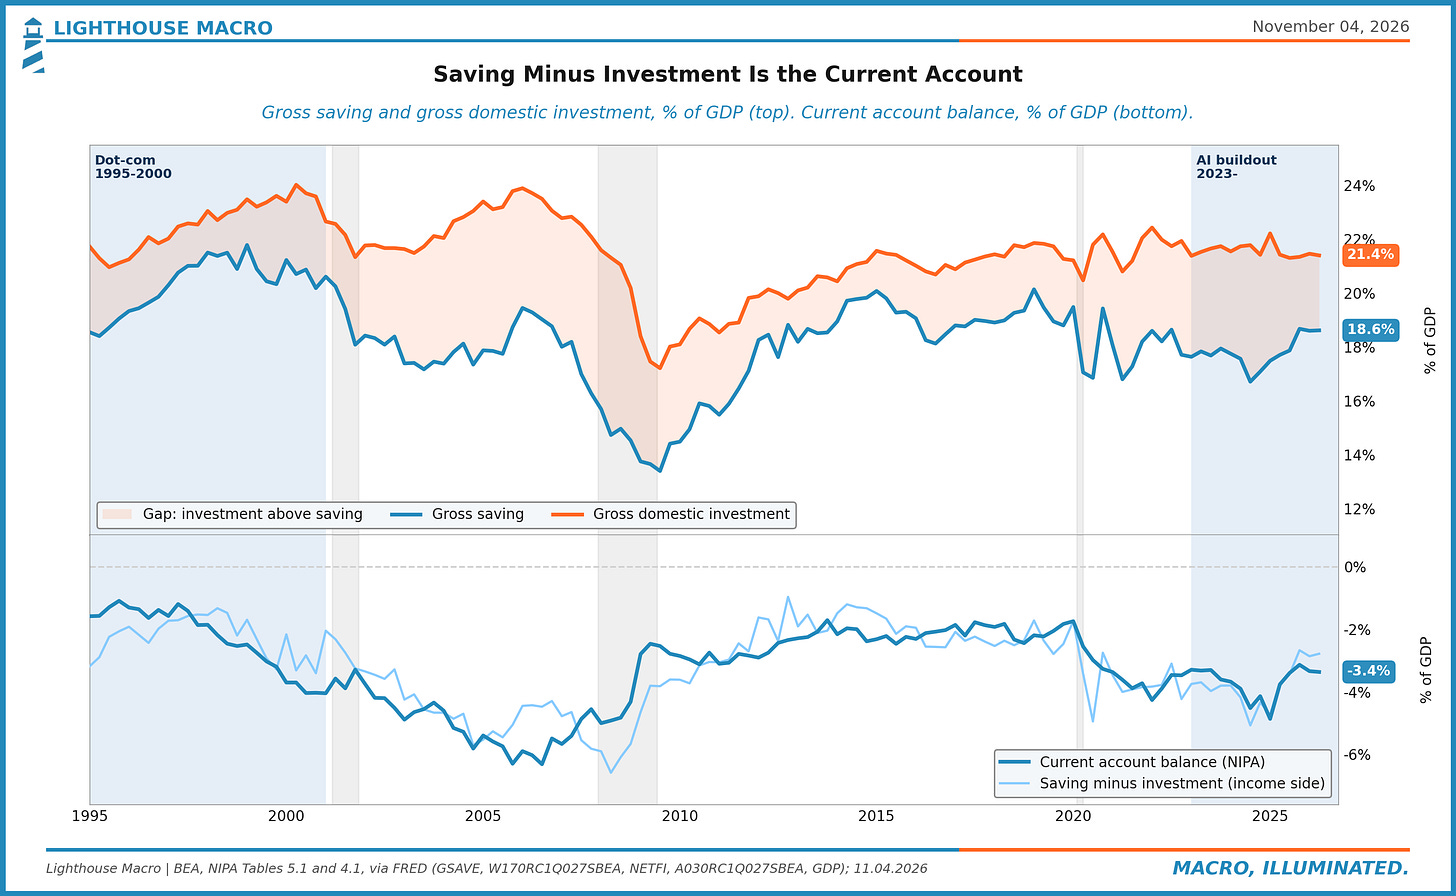
Saving and investment are on top, the gap foreign money fills shaded in, and the current account is below. Over the post's window, 2023 through the first quarter of this year, the deficit averaged 3.7% of GDP in our data, matching his figure, against 2.1% in the five years before the pandemic (he has 2.2). Nearly all of that widening was in place by 2021, before the buildout got going, the first hint the servers weren't doing it.
A Bigger Slice of the Same Pie
Follow one server through it, assembled in Taiwan, say, and bolted into a rack in a data center here. Crossing the border, it's an import. Bought by the data center's owner, it's investment. The same dollar lands on both sides of the identity at once, and on its own, that widens the deficit dollar for dollar.
Di Giovanni puts the condition in one line: "For the AI boom to widen the deficit, it must raise investment without a matching rise in saving." The identity only cares how big total investment is next to saving, so a server bought abroad in place of a factory built at home leaves the deficit where it was, as long as the totals hold still.
Picture a family that buys a very expensive computer the same year it puts off the kitchen remodel. The computer came from out of state and the contractors would have been local, so where the money went changed a lot. How much went out the door didn't, and neither did what the family saved, so it didn't have to borrow a dollar more. For a country, though, the contractors are family too, and if they sit idle the country earns and saves less, so the saving side needs a look as well.
Here's the pie, slice by slice, since the end of 2019.
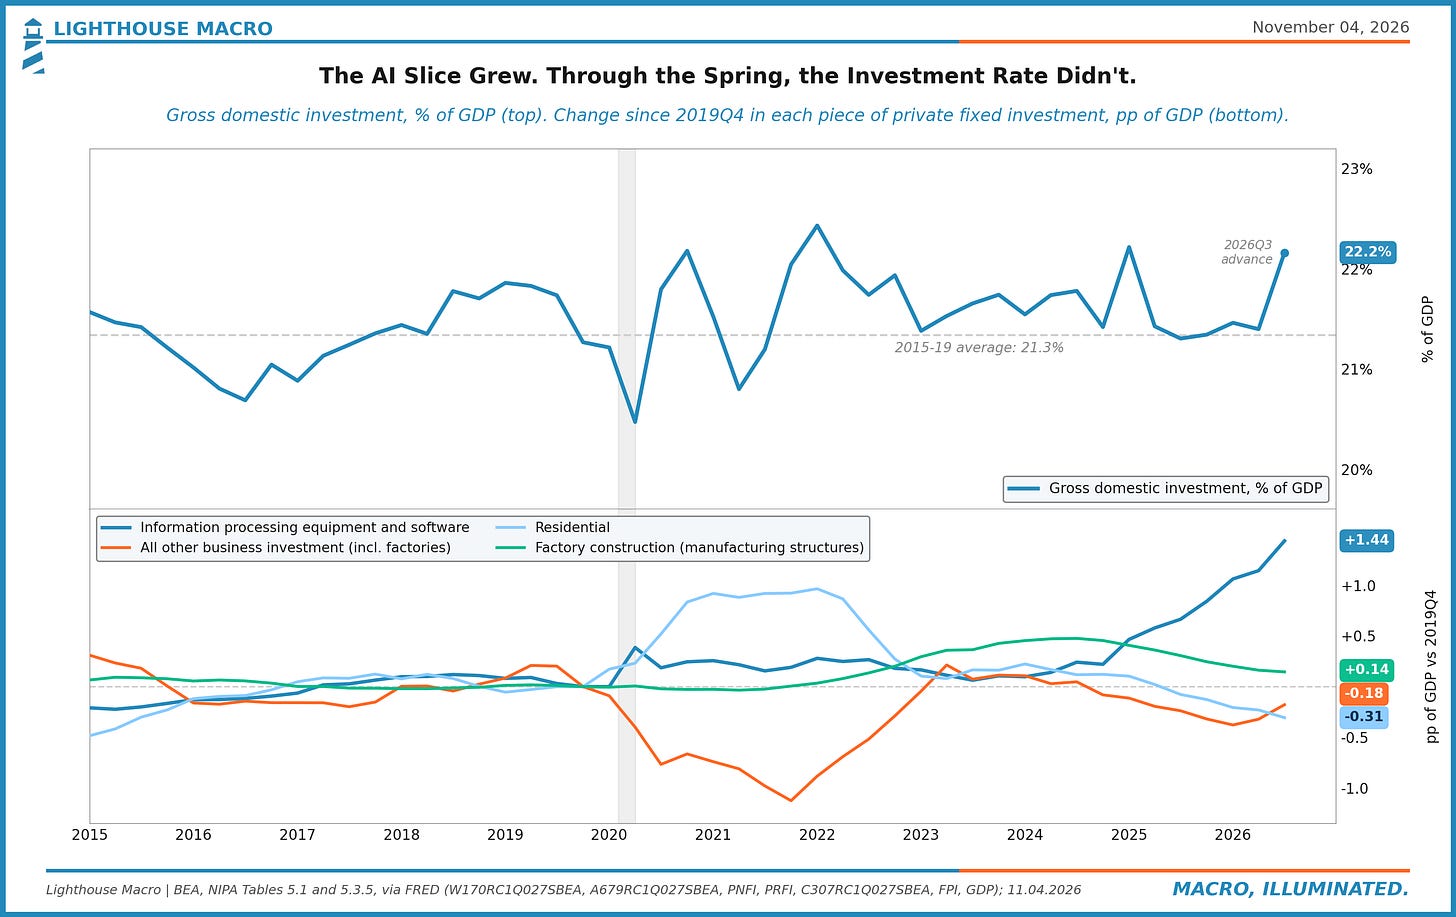
The AI slice is real, and it's big. Business investment in information-processing equipment and software, the closest thing the BEA publishes to an AI line (it also counts every piece of software any company buys), went from 3.9% of GDP at the end of 2019 to 5.0% in the first quarter of this year, where the post's data ends. By the third quarter it was 5.3%, the highest in data going back to 1947.
Meanwhile the factory-building boom that followed the 2022 industrial-policy push has given back most of its gains, housing investment is at its smallest share of the economy since 2015, and business investment outside tech has slipped. Over the post's window, add the slices up and the total barely moved: gross investment averaged 21.3% of GDP in the five years before the pandemic and 21.6% from 2023 through the first quarter. The country bought the computer and put off the kitchen. The third quarter's first estimate shows the total starting to move too, and we'll come back to that at the end.
If that feels like a magic trick, Thomas Klitgaard has a cleaner version in a Liberty Street post from last year that the author links to. In 2011, oil was roughly three-quarters of the US current account deficit. Domestic oil output surged, the oil deficit was gone by 2019, and the overall deficit was nearly as big as it had been. The total followed the saving gap. The AI version runs the other way, one category ballooning while the rest of trade stood nearly still: by the count behind that 23% (more on it below), AI-related trade was up 73% on 2023 as of January 2026, and everything else was up 3%.
The Last Boom Ran the Other Way
The last time companies poured this much into computing gear was the late 1990s, and that boom did move the deficit. The whole pie grew that time, and private saving fell while it did. Di Giovanni names two ways a boom can drag private saving down: a wealth effect, where stock gains lift household spending, and a fall in business saving, what companies keep from revenue after expenses, before counting what they spend on new equipment and buildings. In the dot-com years, households spent out of their stock gains, and the young telecom and equipment firms doing the building saw profits squeezed while dividends stayed put, so their saving sagged just as their investment peaked.
Between 1995 and 2000, private saving fell nearly 3 points of GDP and the deficit widened 2.5 points, in his numbers and ours, while investment climbed 2.4 points in ours. A tax windfall swung government saving up almost 5 points, more than covering the private drop. So measured saving minus investment moved only about a third of a point in our data, and most of that era's widening sits in the measurement gap we come back to below, which swung about 2 points of GDP over those years.
This time both private channels stayed quiet. Households haven't spent out of their stock gains the way they did in the late 1990s, by the post's reckoning, and the bigger difference is who's doing the spending. This round's builders are, in the post's words, "the most cash-generative firms in the economy," and business saving "has thus far held up through the capex surge rather than eroding against it."
Put the savers side by side, then and now, and the difference is hard to miss.
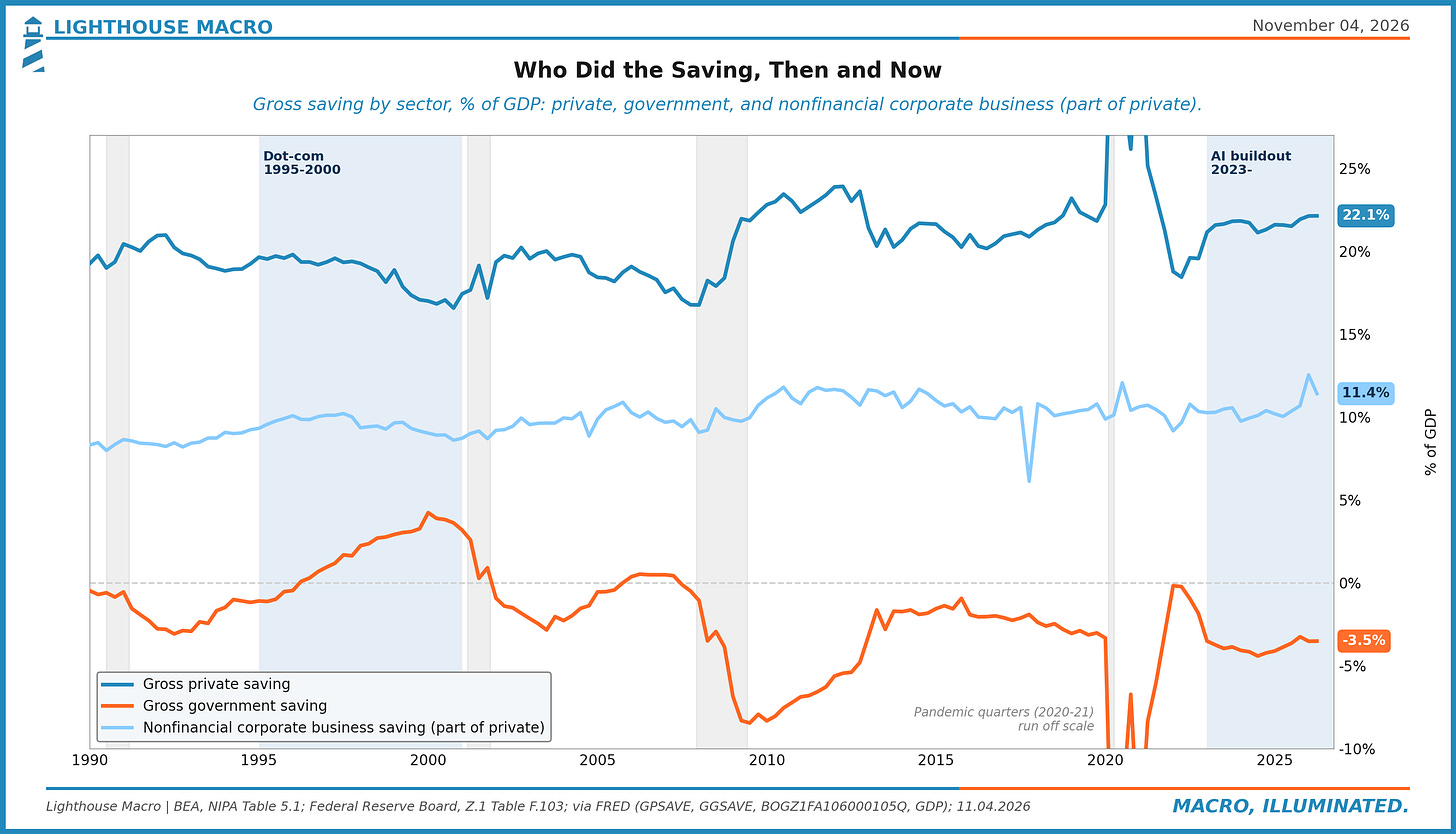
Our version of the business saving line, nonfinancial corporate saving from the Fed's Financial Accounts, averaged 10.9% of GDP over the four quarters through March, exactly the post's figure. Its dot-com low was 8.6%, at the end of 2000.
Who Stopped Saving
Which leaves one sector. In the post's numbers, government saving went from about minus 2.2% of GDP in the five years before the pandemic to about minus 4.0% since 2023. That's the roommate with the credit card, and di Giovanni is direct about it: "changes in fiscal policy have been the major driver of current account dynamics." When government saves less and nobody else saves more to cover it, the country saves less, and with investment flat, the difference gets borrowed from abroad.
Here's where our numbers part ways with his, and we want to be straight about it. The post has private saving since 2023 half a point below where it was before the pandemic, and the BEA data we have today has it a touch above, our best guess being the BEA's annual revisions, since we can't see which release he worked from. If anything that helps his case, because it leaves even more of the widening on the government. Average to average, saving minus investment widened 1.6 points of GDP, and lower government saving alone accounts for about 1.7 of it. The servers changed what the country invests in. The government changed how much it saves, and in the accounting, the deficit tracks the second one. None of that makes it a rule, either: in the late 1990s, government saving climbed almost 5 points and the deficit widened anyway.
Di Giovanni is careful to say this could change. Big tech's announced capital spending plans for 2026 and 2027 are "considerably larger than what has already been built," and the weakness in housing and non-tech investment that offset the AI slice "will not persist indefinitely." If both play out, higher investment and thinner business saving would widen the deficit together. He raises it as a possibility, with no timing or size, and so do we.
Two of the post's links are worth the price of admission, which is still zero.
The first is where that 23% comes from: a Michael Waugh paper at the NBER that had a large language model sort 18,364 import product codes by how relevant each one is to AI infrastructure. So the AI imports were counted, in part, by an AI, which we found more charming than we probably should have. He also works out that the 2025 goods deficit would have been about $194 billion smaller without the AI trade, and calls that "merely an accounting exercise." That's a fair label: it holds the rest of the economy still, and the whole point of the identity is that the rest of the economy doesn't hold still.
The second is the measurement gap Klitgaard's post flags. GDP added up from spending never quite matches GDP added up from income, and that statistical discrepancy sits between saving minus investment and the national-accounts version of the current account, more than half a point of GDP in the second quarter. It's also why the two lines at the bottom of the second chart move so differently in the dot-com years. Include it and the two sides of our rebuild balance in every quarter since 1995 (it's an identity, so they had better, but we checked anyway).
How to Read It
There are three public numbers here, on three clocks. The monthly trade report lands a little over a month after the month ends. The BEA's current account comes once a quarter, near the end of the following quarter. Saving and investment arrive with GDP, investment in the first estimate about a month after the quarter closes and saving a month later, since it needs the income side. The boxes show up first, the explanation second, and the official tally last.
The trap is reading the deficit off one line of the trade report, where a category can balloon while the deficit sits still, or vanish, like oil did, while the deficit stays about as big. When investment rises faster than saving, the deficit widens whatever the import lines look like, and when saving falls, the way the government's has, it widens even if investment never budges. When investment only changes shape and saving holds, the way it did through most of this buildout, the deficit stays put no matter how many servers clear customs.
What It's Saying Now
Briefly, since this is the part that changes every quarter.
In the second quarter, the latest with both sides of the ledger filled in, saving was 18.6% of GDP against investment of 21.4%, a gap of 2.8 points. The current account deficit was 3.4%, a little narrower than its 3.7% average since 2023. That extra half point is the measurement gap from the footnotes. (The balance-of-payments version in the first chart, built from different source data, has it at 3.0%.) Government saving is still at minus 3.5%, well below where it sat before the pandemic, while private saving, business saving included, sits above its own.
The third quarter's first estimate has investment up to 22.2% of GDP, its highest since early 2025, though about half of that jump is inventories, and the saving side for that quarter comes with the next estimate. Since the end of 2019, the AI slice is up 1.4 points of GDP and housing and other business investment are down about half a point between them, so total investment now sits about 0.9 point higher. That's how the post's caveat would start to show, on one advance estimate so far.
For the trade side, the card we look at sits on the Trade board in Pharos.
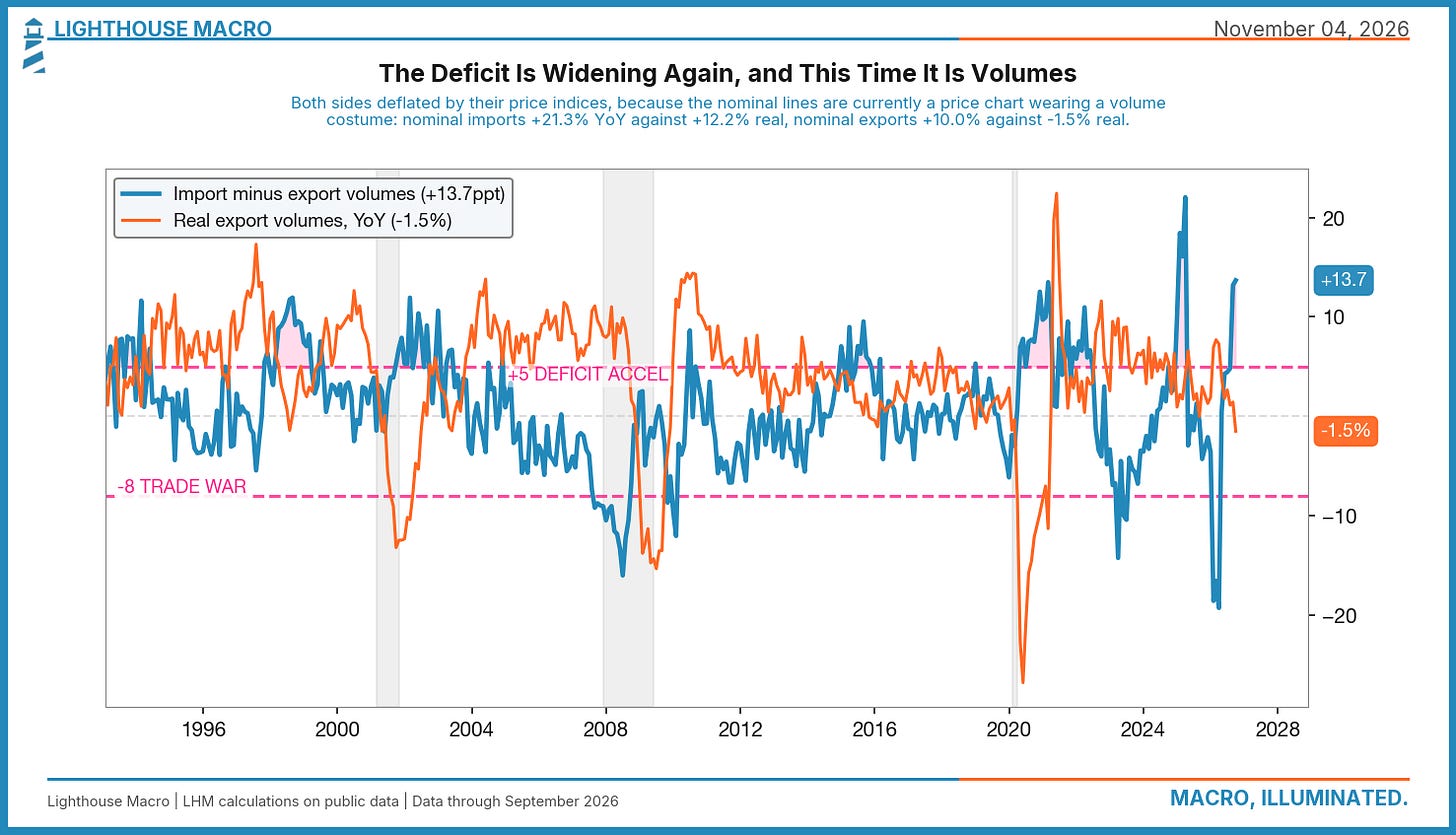
On the board, real imports were up 12.2% on the year through September and real exports were down 1.5%, so the trade gap is widening on volumes in the same quarter investment jumped. None of that says the deficit is about to blow out. It does mean the quiet stretch the post describes got a little less quiet over the summer.
If you run a business that builds or equips things outside the tech world, the piece of this nearest you is the shape of the pie. For three years the total barely grew. Much of what the AI slice gained came at the expense of housing, factory building and the rest of business investment, and that ground has been your market. If the post's caveat plays out and those drags fade, your orders pick up, and the country leans harder on foreign money to pay for all of it.
At the end of 2000, total investment was 23.6% of GDP, and 4.5 points of it went to information-processing gear and software. In the third quarter it was 22.2%, with 5.3 points in the same slice.