One Step Removed
First and foremost, in this piece, we’ll be introducing a new and ALWAYS FREE weekly educational series: Marginal Matters.
Each week we will dig into some of the lesser-discussed mechanics, relationships, & happenstances across the econosphere to make you more knowledgeable about it in roughly 10 minutes. The idea started with one piece we wrote last November, Banking on Nonbanks, which took a single New York Fed paper, sat with it, dug into the data, and then walked it through our framework piece by piece. It turned out that a lot of people were interested in someone doing exactly that, as it was well received by econ enthusiasts from undergrads to central banks and ended up making it into ’s reading list. In the spirit of transparency, the biggest reason for this series is that I am chasing the high of learning that an article I wrote from the back of an overly crowded Greyhound bus I booked 30 min earlier to save my Thanksgiving might have influenced the IMF in some way, however minuscule that may be.
The second update is on the trading side. Crosscurrents, the strategy we built and the live book we’ve been tracking since, is getting a scheduled cadence. Last month we dove deeper into The House View, plus the regime work, portfolio construction & historical performance behind it. Since then, though, it’s been kept exclusively behind Pharos & the paywall. Some of the trading work will always remain exclusive to paid subscribers, but the current setup is a disservice to myself and to all of you, so we’re changing it. More details & portfolio thoughts for you all in a dedicated piece, coming soon.
Don’t navigate in the dark. Join the Watch.
Research Only, $495/yr: every Beam, Beacon, Horizon and Chartbook.
Complete, $750/yr: all of it plus Pharos, the terminal the research is built on.
Now, this week’s Marginal Matters… ECONOBOTs, NERD OUT!!
(Sorry, I was watching Transformers late last night… we’re leaving it.)
Private Credit, Public Balance Sheets
When people picture private credit, they’ll likely have a variety of images in their head, but almost none of them would include a healthy borrower with a traditional bank as its creditor. Some might describe a scenario where a fund raises capital from pensions and insurers, lends it to a company a bank wouldn’t touch, and the bank is nowhere in the picture. Others might talk about Buy Now, Pay Later (BNPL) lenders popularized by firms like Klarna and Afterpay, where the picture is a guy using it to fund burrito purchases before inevitably defaulting. Both have truth to them, and both sit under the same broad umbrella that is ‘private credit.’ Both are also misleading in the same way: they leave the banks out.
The banks are still there. They just moved back a step.
If that sounds familiar, it is where Banking on Nonbanks left off. Nicola Cetorelli and Saketh Prazad at the New York Fed showed that a lot of nonbank growth actually happened inside bank holding companies, and that the post-crisis rulebook pushed banks to shrink those nonbank arms. Our read at the time was that the business didn’t go away when it left the building. It moved to independent nonbanks, and the banks kept funding it from the outside through credit lines. That lets the nonbanks go where the traditional banks can’t, while the banks still enjoy the spoils of those transactions and, to the public eye, stay above everything that comes with subprime lending.
For any Star Wars fans, Darth Maul and Darth Sidious (aka Palpatine) are a strong analogy. Maul ran around seemingly unchecked, rabid in his pursuits, as Palpatine coolly charmed his way through Senate meetings. The eyes on Palpatine make it impossible for him to act the way Maul does. The fruits of his apprentice’s efforts are worth any risk to Palpatine at the time. Thus, he encourages the behavior so long as he continues to gain. In this story, the banks are Palpatine.
In the earlier piece, we said that it would be key to watch those credit lines for any early signs of stress on the system. We didn’t put any exact numbers or levels on that at the time. We will now.
The line on the balance sheet
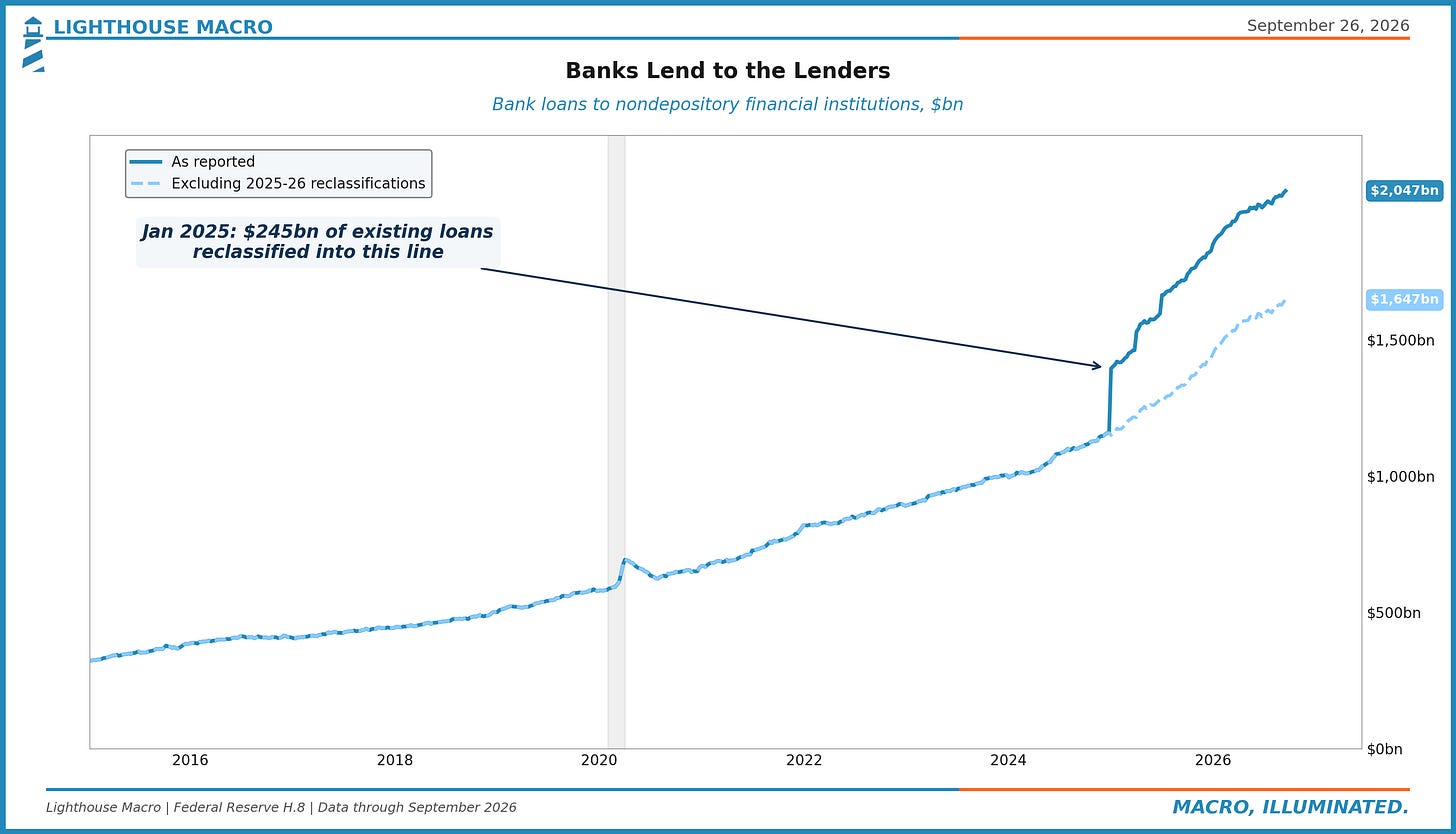
Every week the Federal Reserve publishes what US commercial banks hold, in a release called the H.8, and buried down in the loan book is a line that gets very little attention, even from people who do this for a living: loans to nondepository financial institutions. In plain English, what banks lend to financial firms that don’t take deposits. Business development companies and private credit funds, mostly through credit lines, but also mortgage lenders, consumer finance companies, and a long tail of others we can’t see. The H.8 doesn’t split them out, and we won’t pretend it does.
The weekly series starts in 2015. In the first week of January that year the line stood at $323 billion, 4.2% of everything US banks had lent. By the end of 2024 it was $1.16 trillion, and 9.2%.
Then the accounting changed, and we want to be straight about it, because it touches every number that follows and because it’s the kind of thing that gets skipped when a chart is going up and to the right. During 2025, banks moved about $400 billion of loans they already held into this line, most of it in a single week in January, and the Fed footnotes every one of those moves in the release. The loans were always to nonbanks. They had just been filed under business lending, consumer lending and “all other.” So the reported line now reads $2.05 trillion as of September 16, or 14.5% of all bank loans, and a chunk of that jump is paperwork.
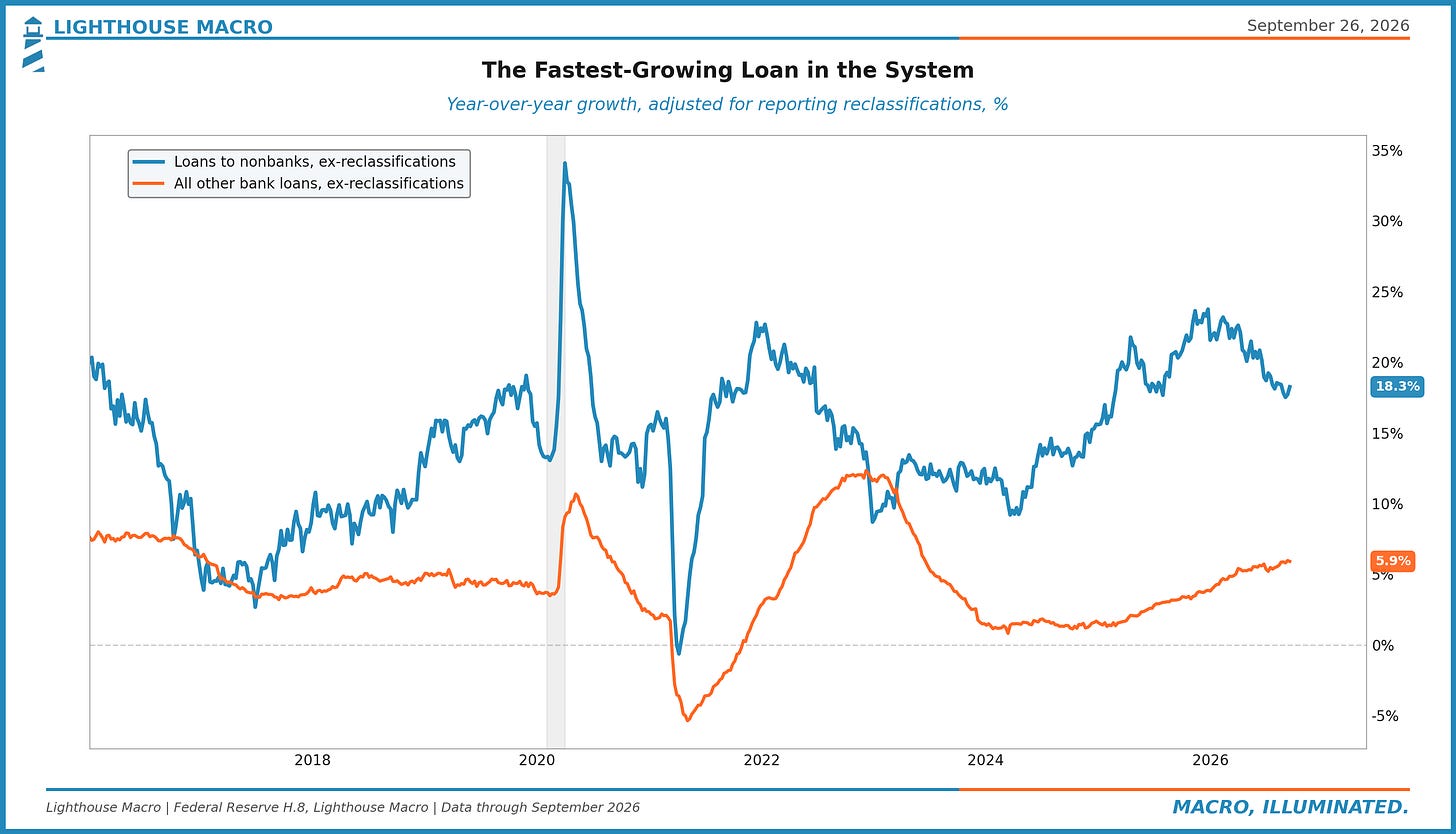
Strip the paperwork out and the growth is still the story. Net of the reclassifications, loans to nonbanks are up 18.3% from a year ago. Every other loan on US bank balance sheets, added together and adjusted the same way, is up 5.9%.
Why a bank lends to a lender
Think about what changed for the banks after 2008. Lending directly to a leveraged mid-sized company got expensive to hold, in capital and in scrutiny, and so that business drifted to funds, and the funds needed leverage to make the returns work, and the cheapest, safest-looking leverage anyone was offering was a senior, secured credit line from a bank. Follow that around the loop and you land somewhere slightly absurd. The bank that stopped making the loan now finances the lender who makes it, one layer up the capital structure, with a claim on a diversified pool instead of a single borrower.
On paper it’s a sensible trade for the bank. We’d probably make it too. And the Fed has put numbers on how much the funds now lean on it. In a note published in August, Sharjil Haque and Jessie Jiaxu Wang found that bank loans make up roughly 40% of business development company debt, up from about 20% a decade ago, and that around 90% of it comes as credit lines. It’s concentrated, too. The three biggest bank lenders account for 47% of what’s drawn, and the top ten for more than 84%.
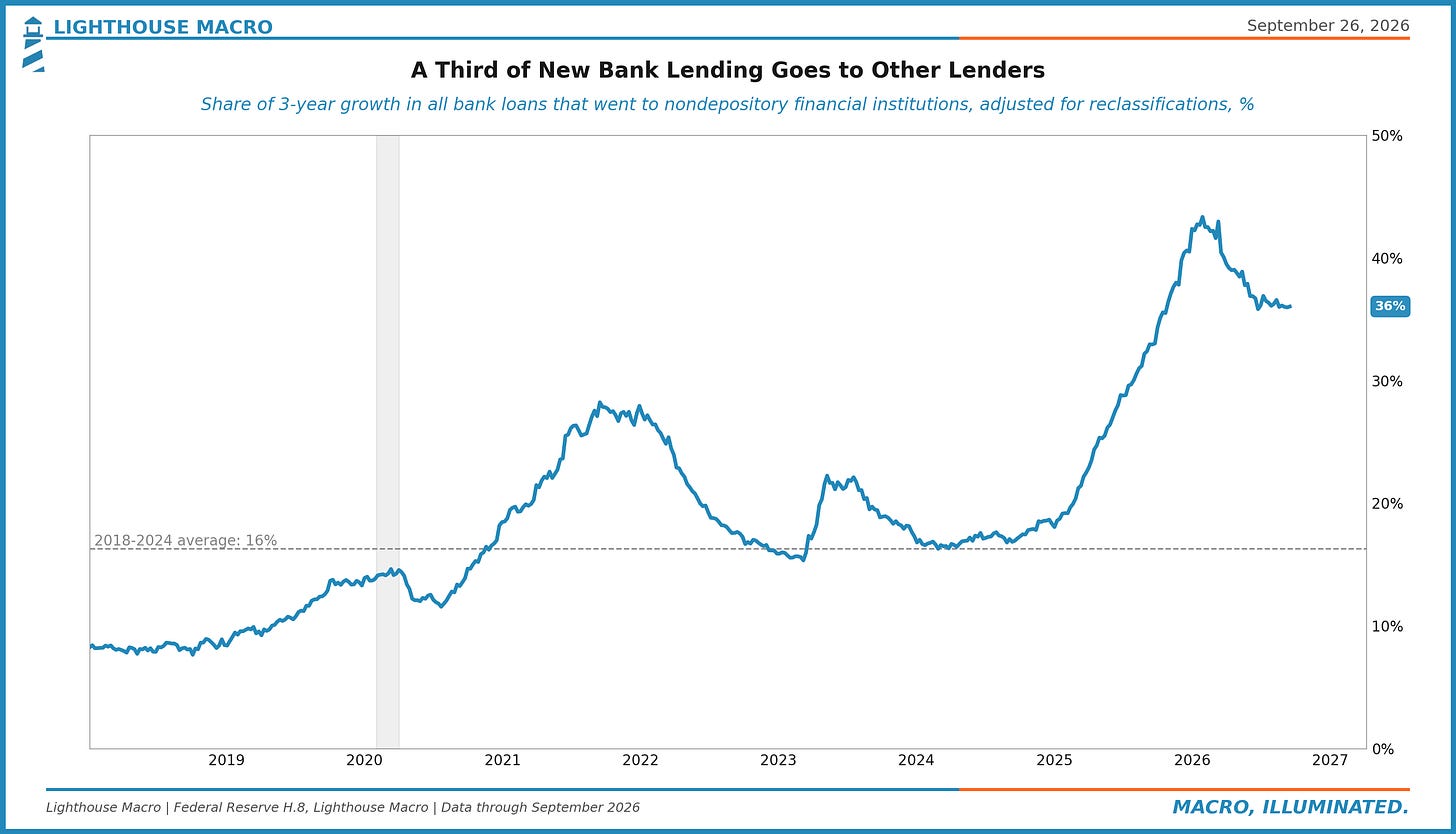
Now put the flows side by side. Over the past three years, total loans at US banks grew by about $1.86 trillion, again net of the reclassifications. Loans to nonbanks account for $671 billion of that. Which is to say that 36% of all the new lending in the country’s banking system went to other lenders. Before 2020 that share ran in single digits and low teens.
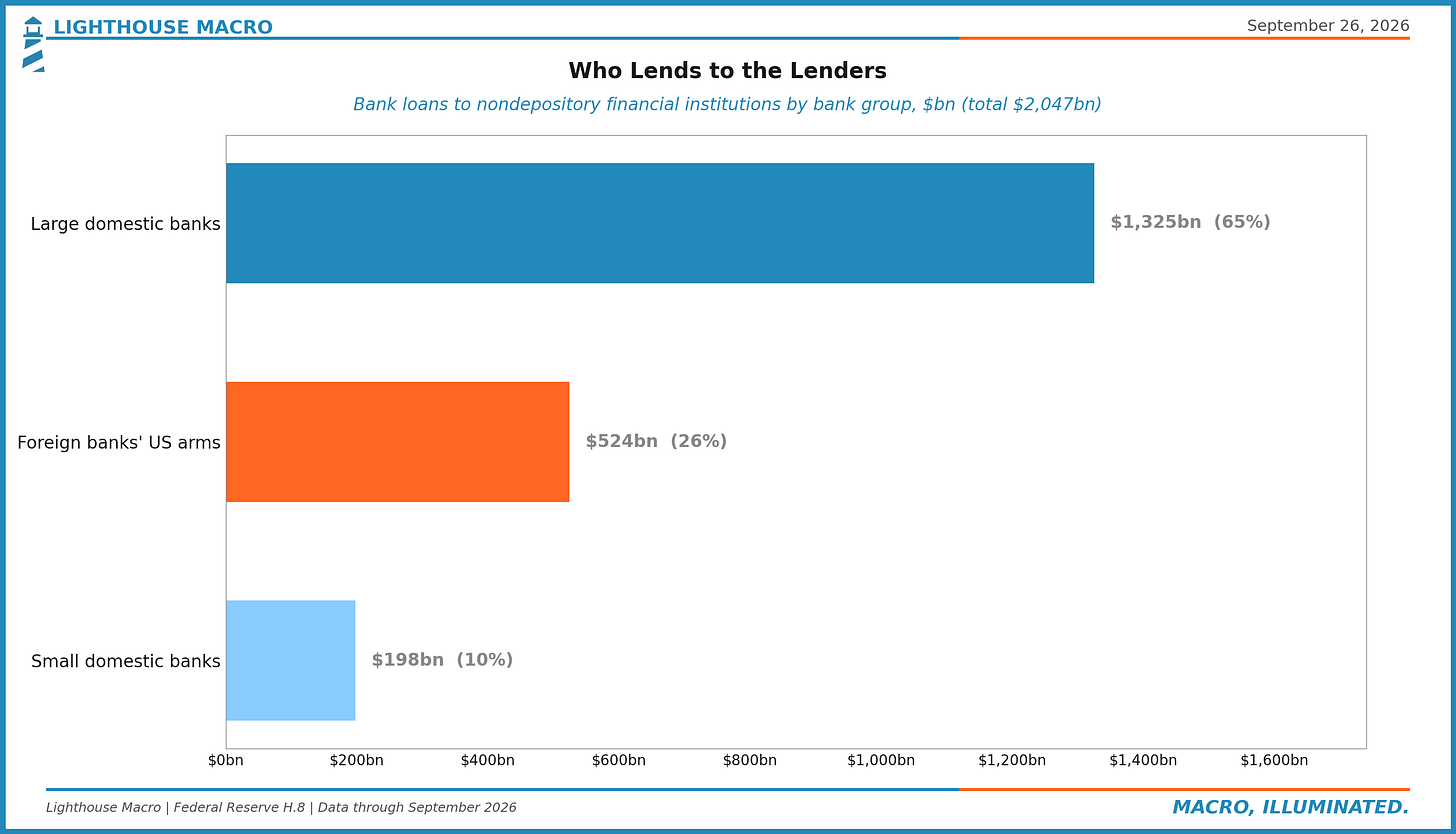
And it isn’t one corner of the system doing it. Large domestic banks hold $1.33 trillion of these loans, the US arms of foreign banks another $524 billion, and small domestic banks $198 billion.
Who the money ends up with
So far this is about the lender’s lender. The Bank for International Settlements went and looked at the other end, the borrowers, in its September Quarterly Review, and what it found is the reason this line deserves more of your attention than it gets.
Puriya Abbassi, Iñaki Aldasoro and Sebastian Doerr tracked where direct lending actually goes. Technology companies were around 22% of it in 2010, 28% by 2019, and almost 45% by 2025. In dollars, direct lending to tech worldwide went from about $22 billion in 2010 to about $127 billion in 2019, and past $1 trillion in 2025, out of almost $2.5 trillion in private credit globally. The underwriting follows the borrower, which is a polite way of saying it changed. These loans get written against recurring revenue and intangible assets and secured with blanket liens, a claim on the value of the whole firm, where a bank of the old school would have wanted a building or a machine it could go and stand in front of.
Here’s the part we keep coming back to. The share of tech borrowers with negative earnings roughly doubled, from 23% before 2020 to 46% after. Over the same stretch, the gap between what the riskiest and the safest of those borrowers pay narrowed, the interquartile range of spreads shrinking from 3.25 to 1.75 percentage points. Weaker borrowers, tighter pricing. The authors are careful to call the stability question open, and so are we. But lenders accepting less pay for more risk is something we’ve watched before, more than once, and when we’ve watched it, it has tended to be late in the cycle rather than early.
A separate Fed note from August, by Banegas and coauthors, gives the size of the pond. In the US, private credit and syndicated leveraged loans were each about $1.4 trillion at the end of 2025. The private credit borrower is smaller (median revenue around $223 million, against $902 million) and carries more debt, a median 5.0 times EBITDA against 3.2 times in leveraged loans, and it pays for that, roughly 500 basis points of spread against 400.
How to read it
The level of this line tells you how much of the banking system is exposed to private credit at one remove. The growth rate tells you whether banks are leaning in or pulling back. Neither one tells you about stress, and that’s the trap, and it’s an easy one to fall into because the line only ever seems to go up.
When pressure arrives, the first thing to move is price. In the 2022 tightening, the Haque and Wang note found, banks charged business development companies an extra premium of about 0.9 percentage points, and the funds drew their credit lines down 14.2 points more than other borrowers did. The balance kept rising the whole time. A rising balance can mean confidence, or it can mean borrowers drawing lines because they have to, and the H.8 can’t tell you which.
So we read it next to what the market charges for leveraged risk. The cleanest public gauge is the high-yield spread, the extra yield on junk bonds over Treasuries.
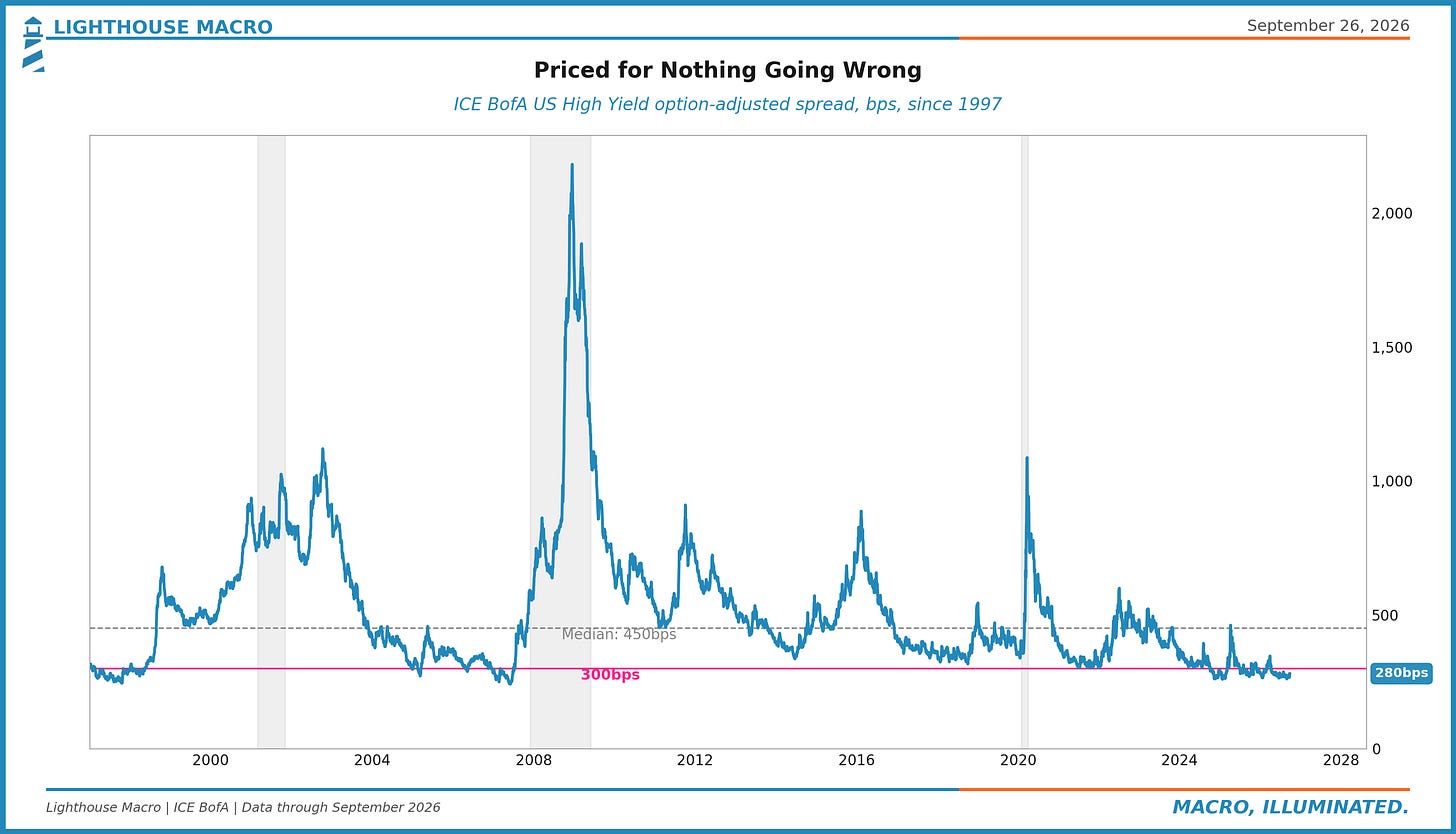
At 280 basis points on September 24, the high-yield spread sits in the 6th percentile of its history since 1997. The long-run median is 450. Our line for complacency is 300, and we’re below it.
What it’s saying now
The fastest-growing loan in the US banking system is the one made to other lenders, and even with the paperwork stripped out, it took more than a third of all new bank lending over three years. At the far end of the chain the borrowers have gotten weaker while the pricing has gotten tighter, and the market is charging about as little as it ever has for leveraged risk. Any one of those on its own is a shrug. Together they describe a system that has built a great deal of lending on the assumption that credit stays cheap and borrowers keep paying, and at 280 basis points, nobody is being paid much of anything to doubt it.
None of that is a crisis call. Private credit has real advantages, and a senior secured line to a diversified fund is a far better place to sit than a direct loan to one shaky company. The point is narrower than that, and we’d rather make the narrow point well.
If you run a business, this is closer than it sounds. A mid-sized company borrowing from a private credit fund is borrowing, one step removed, from a bank’s credit line. When the banks repriced those lines in 2022, the funds passed the cost down. The next repricing reaches the borrower the same way, and it’ll get there faster than a rate cut will.
What would change the read
We’d relax if loans to nonbanks slowed from 18.3% a year toward the 5.9% pace of everything else while spreads stayed tight. That’s banks easing off on their own terms, before anyone makes them. We’d worry more if spreads widened from 280 basis points back toward the 450 median while this line kept climbing, because that combination is what drawn-down credit lines look like on a balance sheet.
The Fed updates the H.8 every Friday afternoon. The last print put loans to nonbanks at $2,047 billion, 14.5% of every dollar US banks have lent. At the end of 2024, before the reclassification, it was 9.2%.